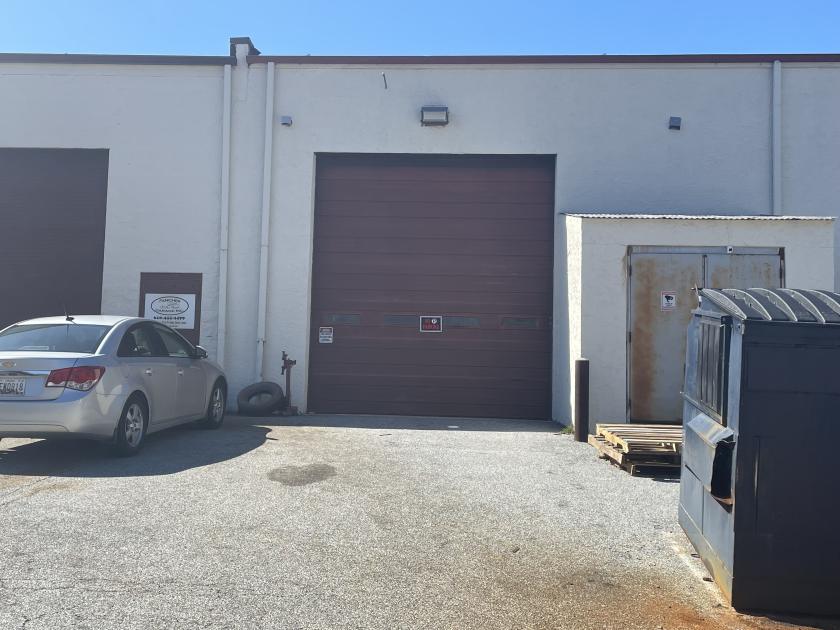
1-Mile | 3-Miles | 5-Miles | ||
---|---|---|---|---|
Total Population | 4,126 | 22,608 | 44,579 | |
Population Median Age | 35 | 42 | 42 | |
Population by Age | 0-9 Yrs | 593 (14%) | 2280 (10%) | 4390 (9%) |
10-19 Yrs | 649 (15%) | 3304 (14%) | 6338 (14%) | |
20-29 Yrs | 725 (17%) | 2710 (11%) | 5023 (11%) | |
30-39 Yrs | 495 (11%) | 2084 (9%) | 4451 (9%) | |
40-49 Yrs | 506 (12%) | 2905 (12%) | 5751 (12%) | |
50-59 Yrs | 468 (11%) | 2993 (13%) | 6323 (14%) | |
60-69 Yrs | 439 (10%) | 3149 (13%) | 5942 (13%) | |
70+ Yrs | 250 (6%) | 3182 (14%) | 6361 (14%) | |
Median HH Income | $76,166 | $95,625 | $115,100 | |
Total Household Income | < 24K | 131 (9%) | 703 (8%) | 1157 (7%) |
25-49K | 245 (17%) | 1398 (16%) | 2219 (14%) | |
50-74K | 306 (22%) | 1342 (15%) | 1995 (12%) | |
75-99K | 154 (11%) | 1030 (11%) | 1655 (10%) | |
100-199K | 353 (25%) | 2389 (27%) | 4540 (28%) | |
200K+ | 188 (13%) | 1723 (20%) | 4200 (26%) | |
Highest Education Level | No Diploma | 245 | 1458 | 2810 |
Diploma or GED | 527 | 3121 | 5723 | |
Some College | 379 | 1960 | 3854 | |
Assoc. Degree | 111 | 754 | 1423 | |
Bachelors Degree | 664 | 4120 | 8738 | |
Higher Degree | 562 | 3779 | 8307 | |
Total Housing Units | 1,473 | 8,948 | 16,471 | |
--Owner-Occupied | 780 | 6,205 | 12,337 | |
--Renter-Occupied | 597 | 2,379 | 3,429 | |
Owner-Occupied Values | < 100K | 6 | 136 | 207 |
100-199K | 61 | 326 | 496 | |
200-299K | 217 | 1342 | 1834 | |
300-399K | 191 | 1261 | 2514 | |
400-499K | 132 | 1245 | 2882 | |
500K+ | 172 | 1895 | 4403 | |
Total Working Age Population | 3,123 | 18,379 | 36,279 | |
In Work Force | 2,310 | 12,168 | 22,176 | |
Not In Work Force | 813 | 6,211 | 14,103 | |
Workforce Employed | 2,187 | 11,701 | 21,315 | |
Workforce Unemployed | 123 | 467 | 859 | |
Civlian Workforce | 2,310 | 12,168 | 22,174 | |
Military Workforce | 0 | 0 | 2 | |
Total Households | 1,377 | 8,585 | 15,766 | |
Family Households | 1,097 | 6,329 | 12,027 | |
Non-Family Households | 280 | 2,255 | 3,739 | |
Married Couple | 684 | 5,108 | 10,249 | |
Other Family | 413 | 1,221 | 1,778 | |
Married w/Child | 260 | 1,804 | 3,844 | |
Single Male w/Child | 68 | 162 | 254 | |
Single Female w/Child | 197 | 535 | 722 |
Population Change Last Two Decades - Plus Projection
2000 | % | 2010 | % | 2020 | % | 2030 | |
---|---|---|---|---|---|---|---|
Delaware | 783,600 | +15 | 897,934 | +10 | 989,803 | +6 | 1,044,965 |
New Castle County | 500,265 | +8 | 538,479 | +6 | 571,165 | +4 | 596,221 |
Pennsylvania | 12,281,054 | +3 | 12,702,379 | +4 | 13,230,170 | +4 | 13,759,594 |
Chester County | 433,501 | +15 | 498,886 | +7 | 533,837 | +7 | 573,576 |
Total Working Age Population:
Total Households:
Total Working Age Population:
Total Households:
Total Working Age Population:
Total Households: