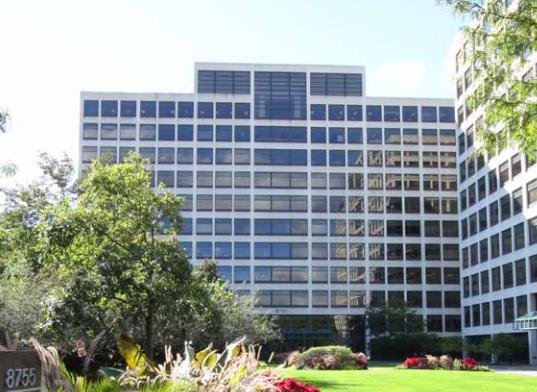
Office Space
8755 West Higgins Road Chicago, IL 60631
8755 West Higgins Road Chicago, IL 60631
Details & Description
Property Highlights
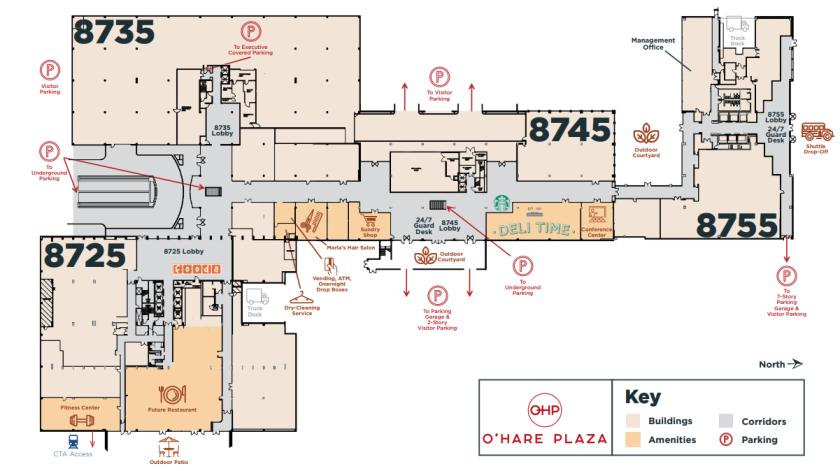
- • Adjacent to Chicago Marriott O’Hare hotel
- • Monument signage available
- • Grade-level executive heated parking garage
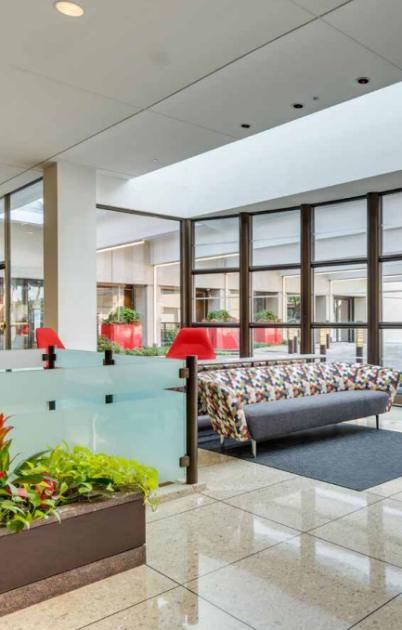
- • Newly renovated, modern lobbies
- • New outdoor courtyard with abundant green space
- • Conference center with seating for 50 people
Additional Photos
Listing Agents

Jeff Shay
O: 773-858-1692
jeff.shay@jll.com
O: 773-858-1692
jeff.shay@jll.com

Rick Benoy
O: 773-304-4105
rick.benoy@jll.com
O: 773-304-4105
rick.benoy@jll.com
While we strive to provide the most accurate information, all listing information, and demographic data, is provided by third-parties. As such, MyEListing will not be responsible for the accuracy of the information. It is strongly recommended that you verify all information with the listing agent, and any relevant agencies, prior to making any decisions.


