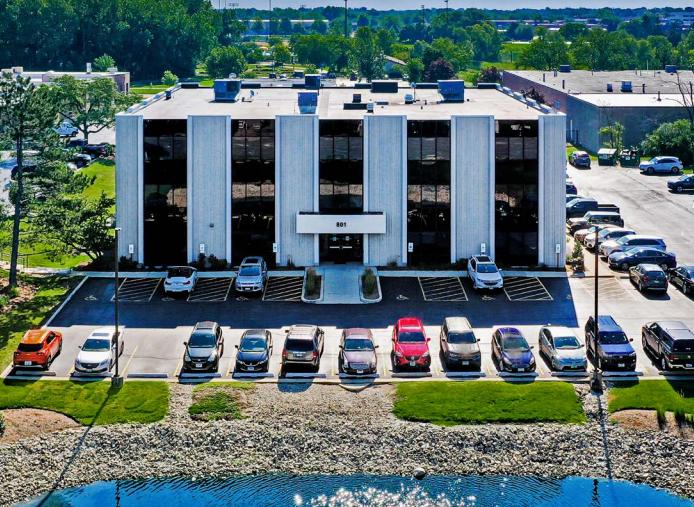
1-Mile | 3-Miles | 5-Miles | ||
---|---|---|---|---|
Total Population | 9,541 | 90,499 | 251,893 | |
Population Median Age | 44 | 41 | 41 | |
Population by Age | 0-9 Yrs | 1059 (11%) | 11122 (12%) | 30288 (12%) |
10-19 Yrs | 1092 (11%) | 11908 (13%) | 30612 (12%) | |
20-29 Yrs | 912 (9%) | 9254 (10%) | 26692 (10%) | |
30-39 Yrs | 950 (9%) | 10351 (11%) | 29368 (11%) | |
40-49 Yrs | 1220 (12%) | 12190 (13%) | 32245 (12%) | |
50-59 Yrs | 1244 (13%) | 13094 (14%) | 37325 (14%) | |
60-69 Yrs | 1294 (13%) | 11165 (12%) | 32714 (12%) | |
70+ Yrs | 1771 (18%) | 11416 (12%) | 32650 (12%) | |
Median HH Income | $77,412 | $96,619 | $97,924 | |
Total Household Income | < 24K | 685 (17%) | 4742 (13%) | 11309 (11%) |
25-49K | 545 (13%) | 4811 (13%) | 13491 (13%) | |
50-74K | 699 (17%) | 4909 (13%) | 13772 (13%) | |
75-99K | 409 (10%) | 4102 (11%) | 11821 (11%) | |
100-199K | 1046 (26%) | 9467 (26%) | 29729 (30%) | |
200K+ | 553 (14%) | 7987 (22%) | 18702 (18%) | |
Highest Education Level | No Diploma | 483 | 2476 | 6652 |
Diploma or GED | 1094 | 8935 | 27369 | |
Some College | 1134 | 8990 | 29220 | |
Assoc. Degree | 536 | 3859 | 11604 | |
Bachelors Degree | 2360 | 22066 | 61201 | |
Higher Degree | 1273 | 16578 | 41969 | |
Total Housing Units | 4,227 | 38,562 | 104,837 | |
--Owner-Occupied | 2,759 | 25,994 | 75,136 | |
--Renter-Occupied | 1,179 | 10,022 | 23,688 | |
Owner-Occupied Values | < 100K | 52 | 1043 | 2678 |
100-199K | 184 | 3009 | 8572 | |
200-299K | 924 | 4622 | 16983 | |
300-399K | 560 | 4352 | 16270 | |
400-499K | 342 | 3145 | 8745 | |
500K+ | 697 | 9823 | 21888 | |
Total Working Age Population | 7,803 | 71,763 | 202,281 | |
In Work Force | 4,664 | 46,611 | 132,051 | |
Not In Work Force | 3,138 | 25,152 | 70,230 | |
Workforce Employed | 4,553 | 45,224 | 126,948 | |
Workforce Unemployed | 112 | 1,387 | 5,074 | |
Civlian Workforce | 4,664 | 46,611 | 132,021 | |
Military Workforce | 0 | 0 | 30 | |
Total Households | 3,939 | 36,017 | 98,824 | |
Family Households | 2,394 | 23,318 | 66,664 | |
Non-Family Households | 1,544 | 12,699 | 32,160 | |
Married Couple | 1,890 | 19,706 | 56,319 | |
Other Family | 504 | 3,611 | 10,345 | |
Married w/Child | 772 | 8,982 | 23,860 | |
Single Male w/Child | 62 | 543 | 1,136 | |
Single Female w/Child | 97 | 1,202 | 3,305 |
Population Change Last Two Decades - Plus Projection
2000 | % | 2010 | % | 2020 | % | 2030 | |
---|---|---|---|---|---|---|---|
Illinois | 12,419,293 | +3 | 12,830,632 | +12 | 14,316,487 | +6 | 15,138,849 |
DuPage County | 904,161 | +1 | 916,924 | +10 | 1,010,323 | +2 | 1,034,039 |
Cook County | 5,376,741 | -3 | 5,194,675 | +10 | 5,707,832 | +5 | 5,990,243 |
Total Working Age Population:
Total Households:
Total Working Age Population:
Total Households:
Total Working Age Population:
Total Households: