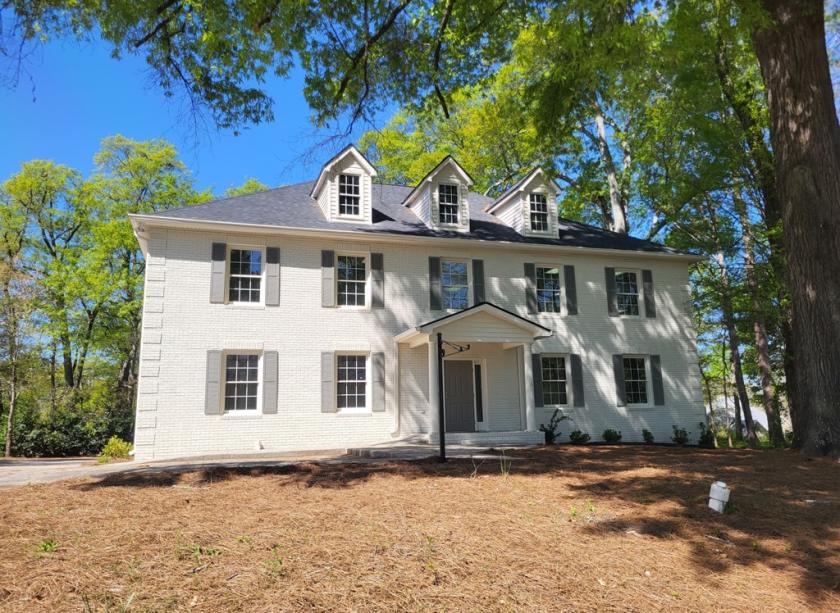
1-Mile | 3-Miles | 5-Miles | ||
---|---|---|---|---|
Total Population | 4,166 | 24,008 | 56,440 | |
Population Median Age | 43 | 42 | 40 | |
Population by Age | 0-9 Yrs | 321 (7%) | 2234 (9%) | 5494 (9%) |
10-19 Yrs | 428 (10%) | 3093 (12%) | 8261 (14%) | |
20-29 Yrs | 692 (16%) | 3137 (13%) | 7473 (13%) | |
30-39 Yrs | 451 (10%) | 2423 (10%) | 5426 (9%) | |
40-49 Yrs | 469 (11%) | 2798 (11%) | 7908 (14%) | |
50-59 Yrs | 717 (17%) | 3807 (15%) | 8888 (15%) | |
60-69 Yrs | 471 (11%) | 2953 (12%) | 6323 (11%) | |
70+ Yrs | 619 (14%) | 3563 (14%) | 6667 (11%) | |
Median HH Income | $64,479 | $79,114 | $81,029 | |
Total Household Income | < 24K | 327 (18%) | 915 (10%) | 1748 (8%) |
25-49K | 379 (21%) | 1528 (16%) | 3127 (15%) | |
50-74K | 311 (17%) | 1828 (20%) | 4360 (21%) | |
75-99K | 281 (15%) | 1461 (16%) | 3127 (15%) | |
100-199K | 408 (22%) | 2672 (29%) | 6158 (30%) | |
200K+ | 82 (4%) | 619 (6%) | 1458 (7%) | |
Highest Education Level | No Diploma | 219 | 915 | 2454 |
Diploma or GED | 918 | 4607 | 10069 | |
Some College | 573 | 3252 | 7912 | |
Assoc. Degree | 249 | 1736 | 3920 | |
Bachelors Degree | 859 | 3976 | 8663 | |
Higher Degree | 376 | 2597 | 5788 | |
Total Housing Units | 1,811 | 9,379 | 20,786 | |
--Owner-Occupied | 941 | 6,879 | 16,021 | |
--Renter-Occupied | 848 | 2,144 | 3,957 | |
Owner-Occupied Values | < 100K | 52 | 258 | 1306 |
100-199K | 517 | 2179 | 5057 | |
200-299K | 248 | 2713 | 5727 | |
300-399K | 102 | 1236 | 2257 | |
400-499K | 20 | 427 | 1122 | |
500K+ | 2 | 66 | 551 | |
Total Working Age Population | 3,589 | 20,043 | 46,447 | |
In Work Force | 1,988 | 12,243 | 29,101 | |
Not In Work Force | 1,601 | 7,800 | 17,346 | |
Workforce Employed | 1,811 | 11,281 | 27,564 | |
Workforce Unemployed | 177 | 887 | 1,411 | |
Civlian Workforce | 1,987 | 12,168 | 28,975 | |
Military Workforce | 1 | 75 | 126 | |
Total Households | 1,789 | 9,023 | 19,978 | |
Family Households | 1,089 | 6,763 | 15,483 | |
Non-Family Households | 700 | 2,260 | 4,495 | |
Married Couple | 676 | 5,173 | 11,339 | |
Other Family | 413 | 1,590 | 4,143 | |
Married w/Child | 258 | 1,806 | 4,006 | |
Single Male w/Child | 34 | 182 | 559 | |
Single Female w/Child | 156 | 579 | 1,309 |
Population Change Last Two Decades - Plus Projection
2000 | % | 2010 | % | 2020 | % | 2030 | |
---|---|---|---|---|---|---|---|
Georgia | 8,186,453 | +18 | 9,687,653 | +12 | 10,833,472 | +13 | 12,292,423 |
Clayton County | 236,517 | +10 | 259,424 | +18 | 304,838 | +22 | 373,234 |
Fayette County | 91,263 | +17 | 106,567 | +10 | 117,544 | +17 | 137,595 |
Total Working Age Population:
Total Households:
Total Working Age Population:
Total Households:
Total Working Age Population:
Total Households: