Health Care and Medical Properties
800 Goodlette Road North Naples, FL 34102
800 Goodlette Road North Naples, FL 34102

Details & Description
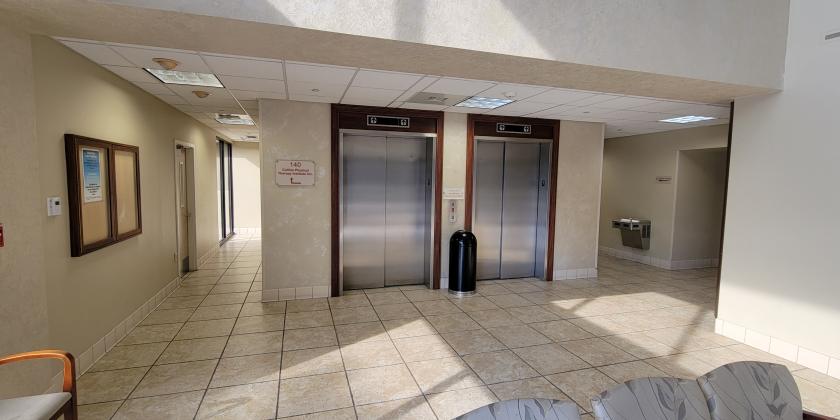
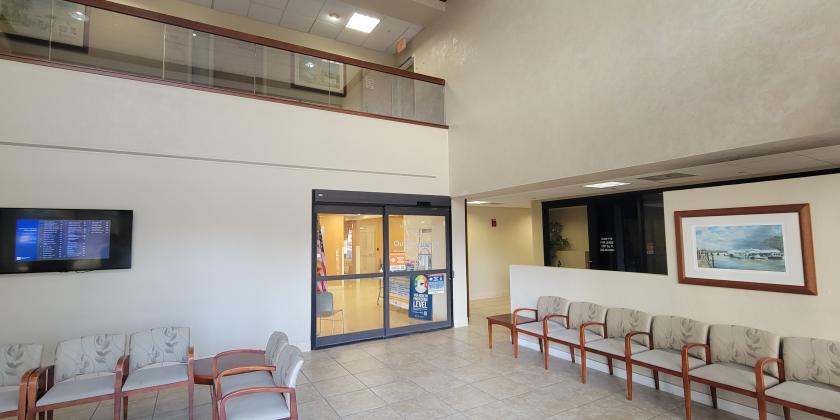
Additional Photos

Listing Agents

Gary Tasman
O: 239-489-3600
M: 239-470-9646
atutor@cpswfl.com
O: 239-489-3600
M: 239-470-9646
atutor@cpswfl.com
While we strive to provide the most accurate information, all listing information, and demographic data, is provided by third-parties. As such, MyEListing will not be responsible for the accuracy of the information. It is strongly recommended that you verify all information with the listing agent, and any relevant agencies, prior to making any decisions.


