Commercial Land
14704 U.S. 290 Manor, TX 78653
14704 U.S. 290 Manor, TX 78653

Details & Description
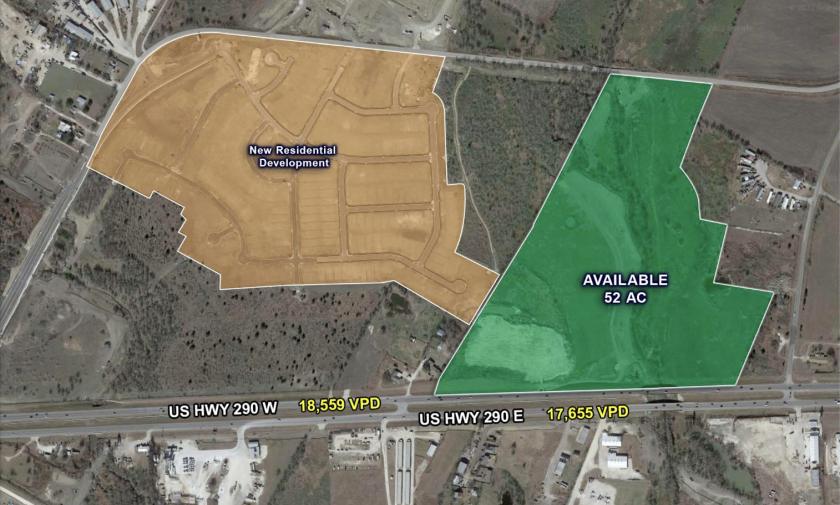
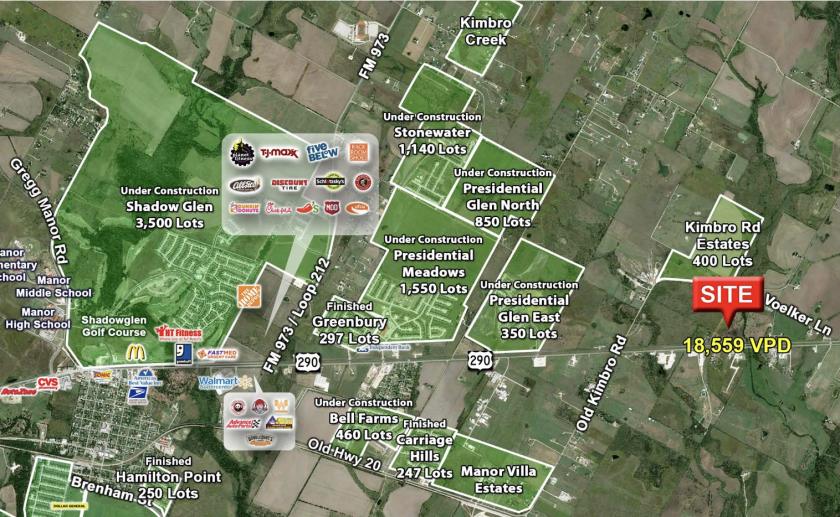
Property Highlights
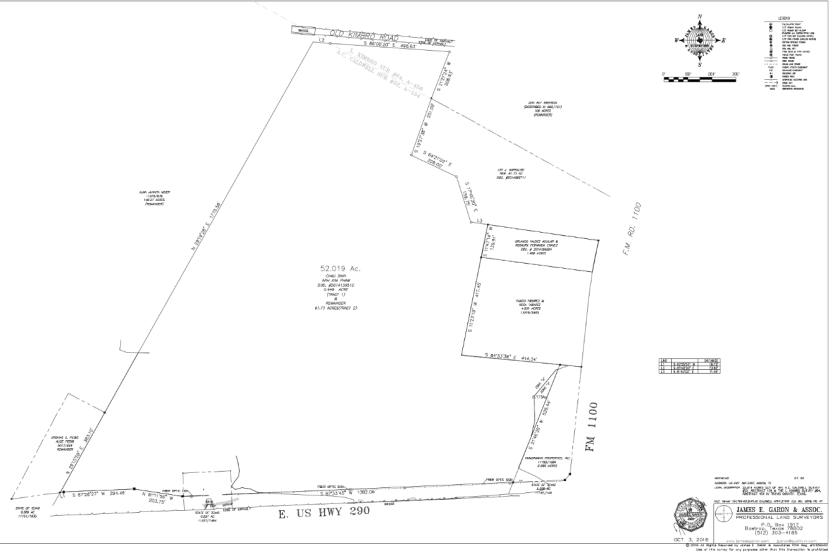
- • 52 acres available
- • Over 1500 feet of Highway 290 frontage
- • All utilities to the property
- • No detention required
Additional Photos

Listing Agents

Janice Landers
O: 512-535-0262
janice@resolutre.com
O: 512-535-0262
janice@resolutre.com
While we strive to provide the most accurate information, all listing information, and demographic data, is provided by third-parties. As such, MyEListing will not be responsible for the accuracy of the information. It is strongly recommended that you verify all information with the listing agent, and any relevant agencies, prior to making any decisions.


