Office Space
5000 South Minnesota Avenue Sioux Falls, SD 57108
5000 South Minnesota Avenue Sioux Falls, SD 57108

Details & Description
Property Highlights
- • Year Built 1999
- • 7 offices, 1 conference room, and reception area
- • Private, in-suite restrooms
- • Private entrance from rear parking lot
- • Monument and front door signage
- • Prime lease expires April 30, 2023
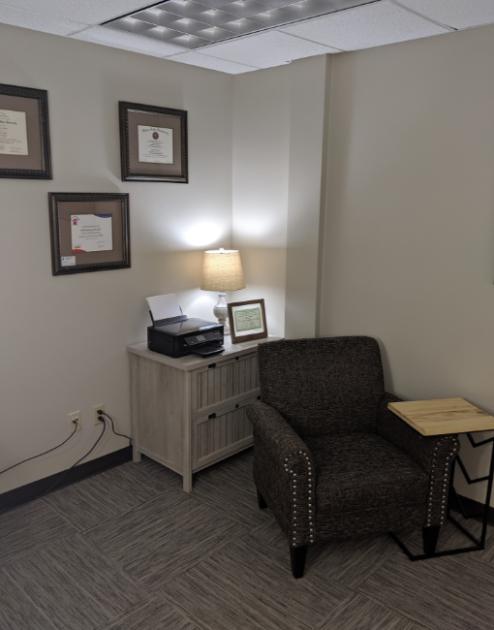
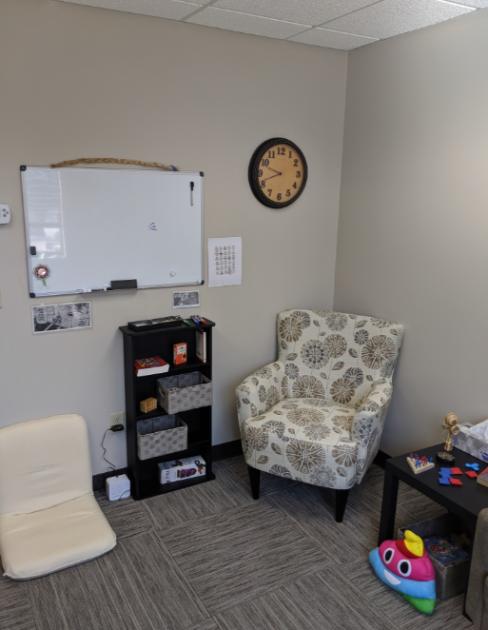
Additional Photos


Listing Agents

Rich Naser
M: 602-366-2059
rnaser@naisiouxfalls.com
M: 602-366-2059
rnaser@naisiouxfalls.com
While we strive to provide the most accurate information, all listing information, and demographic data, is provided by third-parties. As such, MyEListing will not be responsible for the accuracy of the information. It is strongly recommended that you verify all information with the listing agent, and any relevant agencies, prior to making any decisions.