Office Space
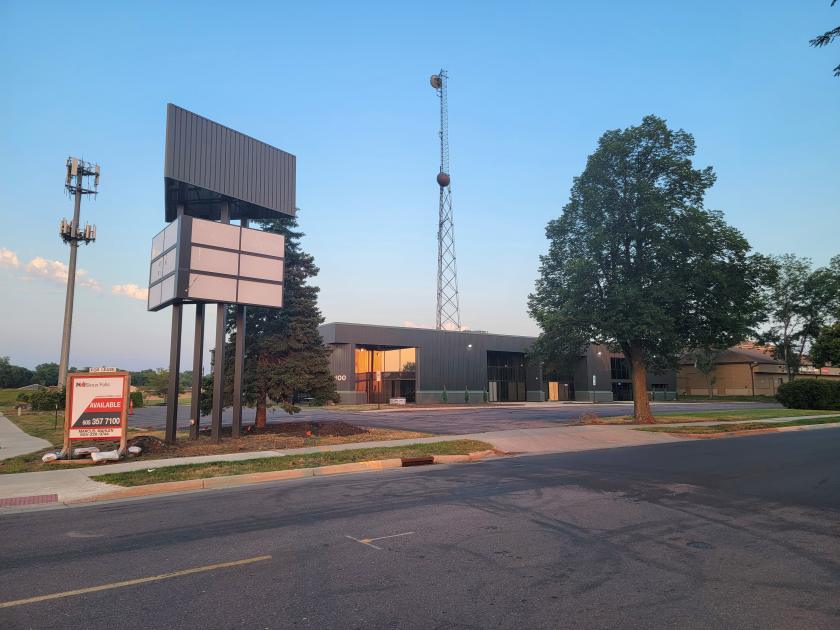
3600 South Westport Avenue Sioux Falls, SD 57106
3600 South Westport Avenue Sioux Falls, SD 57106

Details & Description
Property Highlights
- • Year Built 1978
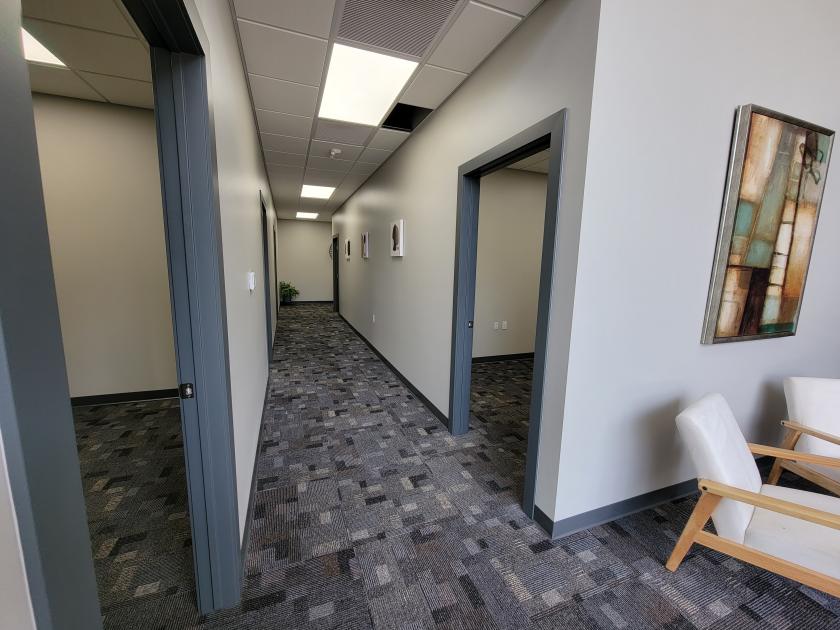
- • Professional office building with several uses
- • Spaces can be designed per tenant need
- • Paved, on-site parking with 68 spaces
- • Zoning: Office
Additional Photos


Listing Agents

Marcus Mahlen
O: 605-444-7116
M: 605-228-9744
mmahlen@naisiouxfalls.com
O: 605-444-7116
M: 605-228-9744
mmahlen@naisiouxfalls.com
While we strive to provide the most accurate information, all listing information, and demographic data, is provided by third-parties. As such, MyEListing will not be responsible for the accuracy of the information. It is strongly recommended that you verify all information with the listing agent, and any relevant agencies, prior to making any decisions.