Office Space
700 East 41st Street Sioux Falls, SD 57105
700 East 41st Street Sioux Falls, SD 57105

Details & Description
Property Highlights
- • Year Built 1968
- • Available immediately
- • Can be subdivided for two tenants - See floor plan
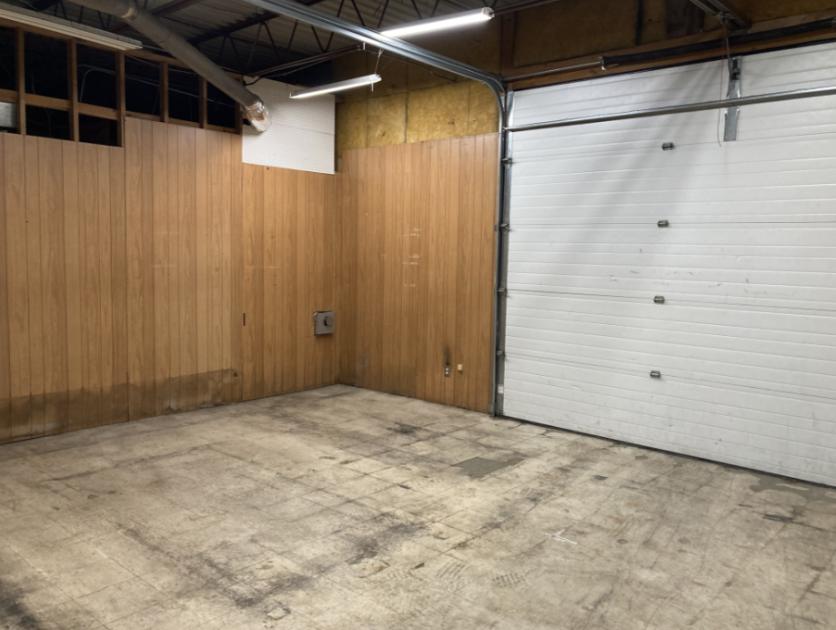
- • 3 overhead doors
- • Estimated NNN expenses: $3.00/sq. ft.
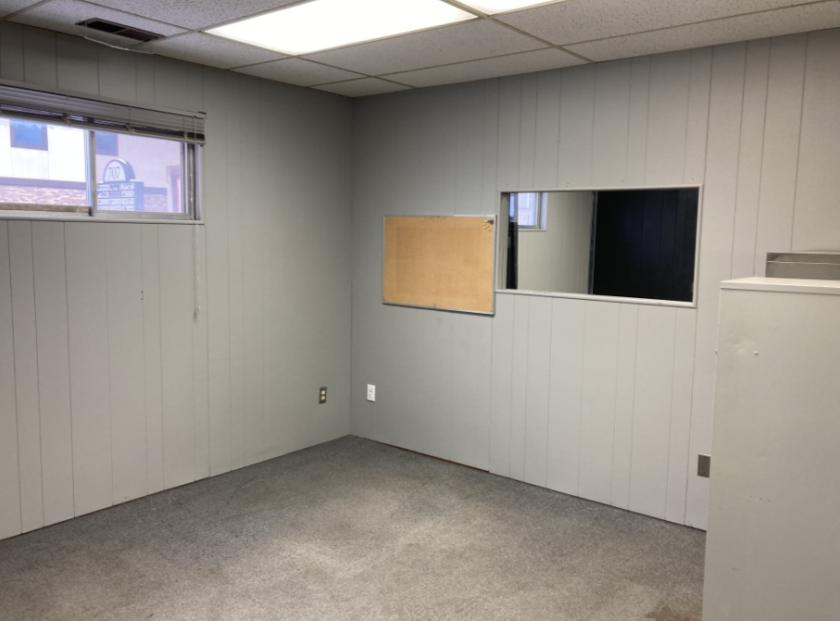
Additional Photos


Listing Agents

Marcus Mahlen
O: 605-444-7116
M: 605-228-9744
mmahlen@naisiouxfalls.com
O: 605-444-7116
M: 605-228-9744
mmahlen@naisiouxfalls.com
While we strive to provide the most accurate information, all listing information, and demographic data, is provided by third-parties. As such, MyEListing will not be responsible for the accuracy of the information. It is strongly recommended that you verify all information with the listing agent, and any relevant agencies, prior to making any decisions.