Commercial Land
61st St and Sycamore Ave Sioux Falls, SD 57108
61st St and Sycamore Ave Sioux Falls, SD 57108
Details & Description
Property Highlights
- • $8.75 - $9.00/sq. ft.
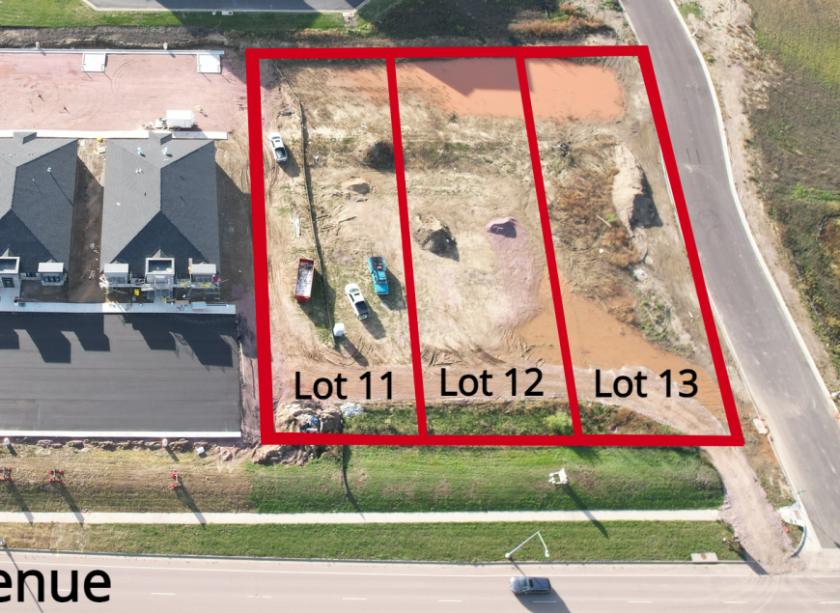
- • Various lots available
- • Lot 11: 22,800 sq. ft.
- • Lot 12: 22,800 sq. ft.
- • Lot 13: 26,573 sq. ft.
Additional Photos


Listing Agents

Craig Hagen
O: 605-357-7100
M: 605-310-4227
chagen@naisiouxfalls.com
O: 605-357-7100
M: 605-310-4227
chagen@naisiouxfalls.com

Gregg Brown
O: 605-444-7103
M: 605-906-0394
gbrown@naisiouxfalls.com
O: 605-444-7103
M: 605-906-0394
gbrown@naisiouxfalls.com
While we strive to provide the most accurate information, all listing information, and demographic data, is provided by third-parties. As such, MyEListing will not be responsible for the accuracy of the information. It is strongly recommended that you verify all information with the listing agent, and any relevant agencies, prior to making any decisions.


