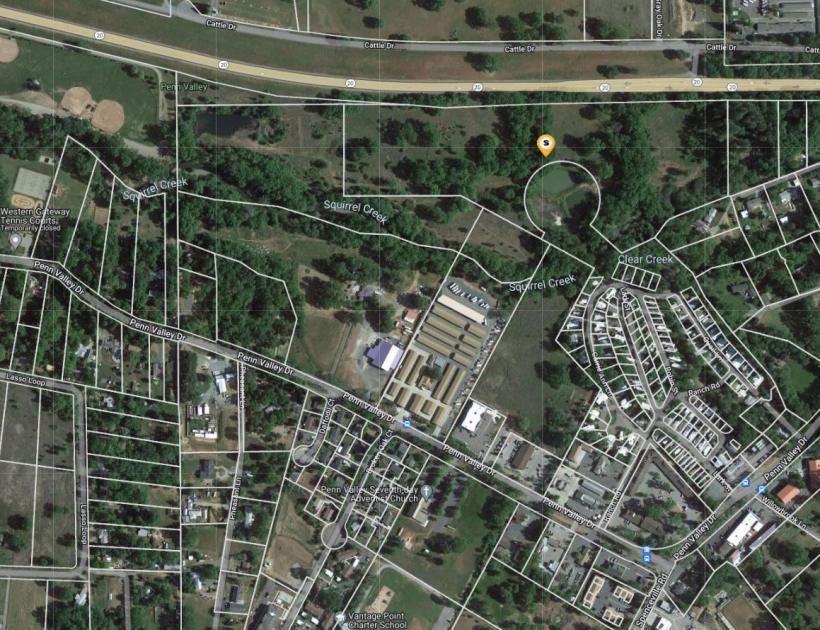
1-Mile | 3-Miles | 5-Miles | ||
---|---|---|---|---|
Total Population | 833 | 6,363 | 13,384 | |
Population Median Age | 45 | 50 | 49 | |
Population by Age | 0-9 Yrs | 70 (8%) | 386 (6%) | 825 (6%) |
10-19 Yrs | 109 (13%) | 682 (10%) | 1534 (11%) | |
20-29 Yrs | 86 (10%) | 392 (6%) | 879 (6%) | |
30-39 Yrs | 115 (13%) | 819 (12%) | 1608 (12%) | |
40-49 Yrs | 50 (6%) | 477 (7%) | 1424 (10%) | |
50-59 Yrs | 101 (12%) | 771 (12%) | 1663 (12%) | |
60-69 Yrs | 145 (17%) | 1202 (18%) | 2515 (18%) | |
70+ Yrs | 157 (18%) | 1633 (25%) | 2937 (21%) | |
Median HH Income | $45,695 | $61,977 | $66,763 | |
Total Household Income | < 24K | 54 (14%) | 471 (16%) | 919 (16%) |
25-49K | 144 (37%) | 686 (23%) | 1256 (21%) | |
50-74K | 67 (17%) | 540 (18%) | 1001 (17%) | |
75-99K | 57 (14%) | 549 (18%) | 924 (16%) | |
100-199K | 40 (10%) | 516 (17%) | 1324 (23%) | |
200K+ | 23 (6%) | 137 (4%) | 299 (5%) | |
Highest Education Level | No Diploma | 49 | 361 | 729 |
Diploma or GED | 112 | 964 | 2151 | |
Some College | 212 | 1705 | 3357 | |
Assoc. Degree | 148 | 680 | 1427 | |
Bachelors Degree | 90 | 1047 | 1935 | |
Higher Degree | 17 | 399 | 1017 | |
Total Housing Units | 467 | 3,685 | 6,937 | |
--Owner-Occupied | 295 | 2,294 | 4,437 | |
--Renter-Occupied | 88 | 605 | 1,286 | |
Owner-Occupied Values | < 100K | 130 | 323 | 396 |
100-199K | 12 | 46 | 83 | |
200-299K | 15 | 309 | 596 | |
300-399K | 65 | 611 | 1190 | |
400-499K | 38 | 448 | 962 | |
500K+ | 35 | 557 | 1211 | |
Total Working Age Population | 669 | 5,463 | 11,509 | |
In Work Force | 323 | 2,475 | 5,654 | |
Not In Work Force | 345 | 2,988 | 5,855 | |
Workforce Employed | 318 | 2,389 | 5,410 | |
Workforce Unemployed | 5 | 65 | 216 | |
Civlian Workforce | 323 | 2,454 | 5,625 | |
Military Workforce | 0 | 21 | 29 | |
Total Households | 383 | 2,899 | 5,723 | |
Family Households | 247 | 1,931 | 3,881 | |
Non-Family Households | 136 | 968 | 1,842 | |
Married Couple | 187 | 1,608 | 3,239 | |
Other Family | 61 | 323 | 642 | |
Married w/Child | 22 | 236 | 592 | |
Single Male w/Child | 10 | 46 | 75 | |
Single Female w/Child | 46 | 170 | 298 |
Population Change Last Two Decades - Plus Projection
2000 | % | 2010 | % | 2020 | % | 2030 | |
---|---|---|---|---|---|---|---|
California | 33,871,648 | +10 | 37,253,956 | +9 | 40,467,295 | +8 | 43,631,295 |
Nevada County | 92,033 | +7 | 98,764 | +1 | 99,578 | +6 | 105,214 |
Total Working Age Population:
Total Households:
Total Working Age Population:
Total Households:
Total Working Age Population:
Total Households: