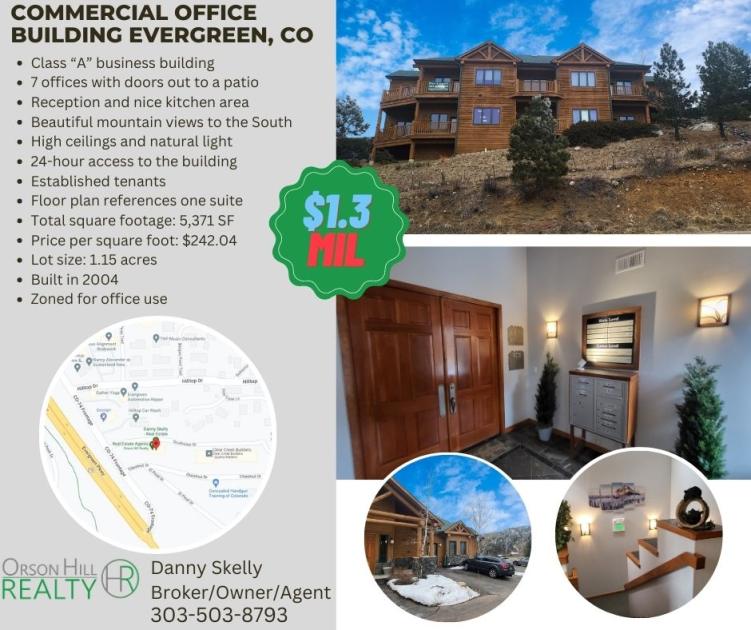
Commercial Office Building for Sale Evergreen
This stunning Class “A” business building is an exceptional commercial real estate listing in Evergreen, Colorado. The property boasts a range of impressive features that make it an ideal space for any business looking for an upscale and professional space to operate from.
Commercial Office Building Specs
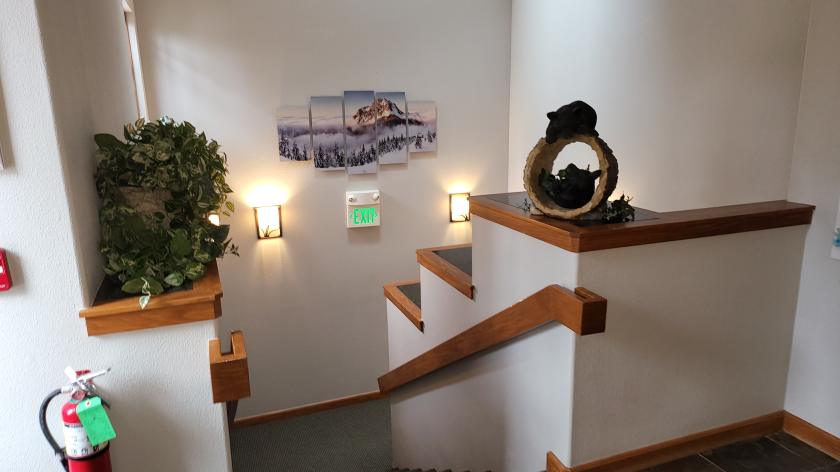
The building comprises of 7 beautifully appointed offices, all of which have doors leading out to a patio. The high ceilings and natural light provide a bright and welcoming atmosphere, creating a productive working environment. The reception and kitchen area are well-designed, offering a stylish and functional space for employees and clients alike.
Why Purchase This Commercial Property
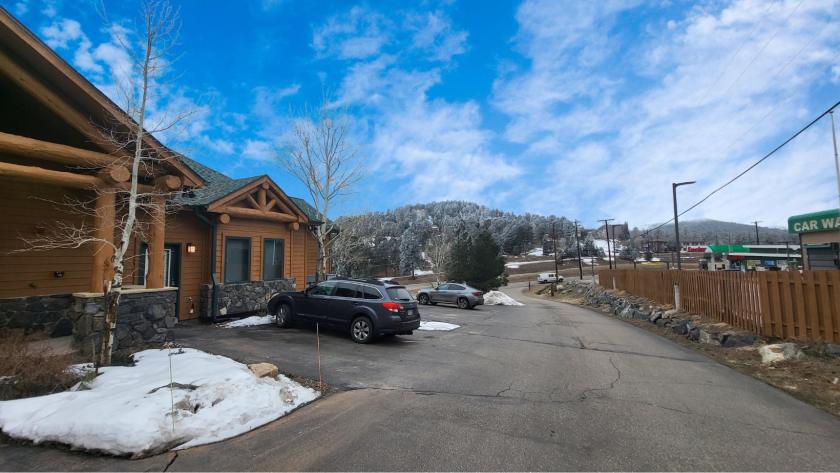
One of the most notable features of this commercial property is the breathtaking mountain views to the South. The natural surroundings create an awe-inspiring setting that is sure to impress anyone who visits the premises.
What Sets This Property Apart
The building also provides 24-hour access, ensuring maximum flexibility for businesses operating in the space. Two established tenants currently occupy the lower level of the building, providing potential for additional income.
Property Breakdown and Information
The lower level has two suites, and the floor plan refers to one. The total square footage of the building is 5,371 SF, and the price per square foot is $242.04. The property sits on a spacious 1.15-acre lot and was built in 2004. It is zoned for office use, making it a highly desirable location for a range of businesses.
Overall, this commercial real estate listing in Evergreen, Colorado, is a rare find. With its Class “A” status, stunning mountain views, and range of impressive features, it is sure to attract a lot of interest from businesses looking for a premier location to operate from.