Commercial Land
Jansmick Land Sioux Falls, SD 57107
Jansmick Land Sioux Falls, SD 57107

Details & Description
Property Highlights
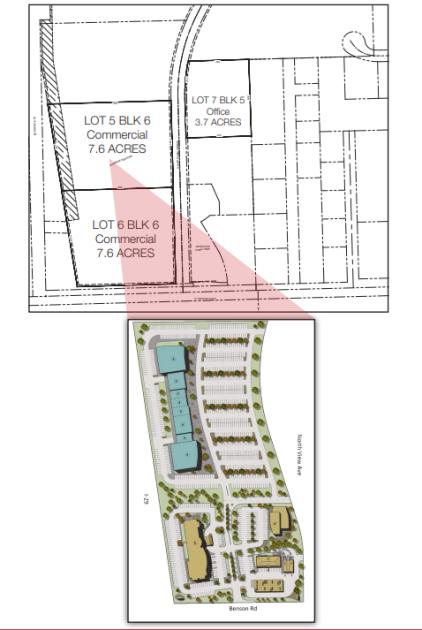
- • Various lot sizes available
- • Zoning: I-1 and C-4 and O
- • Adjacent to I-29 and 1 mile south of I-90
- • Northeast intersection of Benson Road and I-29
- • Located in Opportunity Zone
- • LOT 5 BLK 6 7.6 ACRES
Listing Agents

Craig Hagen
O: 605-357-7100
M: 605-310-4227
chagen@naisiouxfalls.com
O: 605-357-7100
M: 605-310-4227
chagen@naisiouxfalls.com
While we strive to provide the most accurate information, all listing information, and demographic data, is provided by third-parties. As such, MyEListing will not be responsible for the accuracy of the information. It is strongly recommended that you verify all information with the listing agent, and any relevant agencies, prior to making any decisions.