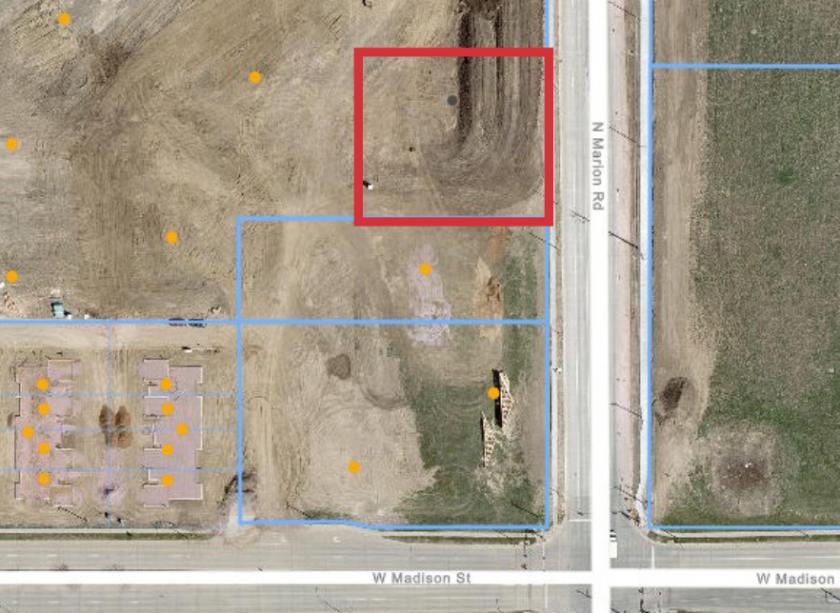
1-Mile | 3-Miles | 5-Miles | ||
---|---|---|---|---|
Total Population | 3,454 | 43,958 | 116,013 | |
Population Median Age | 35 | 36 | 36 | |
Population by Age | 0-9 Yrs | 481 (13%) | 6193 (14%) | 16100 (13%) |
10-19 Yrs | 570 (16%) | 6512 (14%) | 14808 (12%) | |
20-29 Yrs | 509 (14%) | 6141 (13%) | 19252 (16%) | |
30-39 Yrs | 467 (13%) | 6883 (15%) | 19297 (16%) | |
40-49 Yrs | 379 (10%) | 5318 (12%) | 12510 (10%) | |
50-59 Yrs | 435 (12%) | 5165 (11%) | 13623 (11%) | |
60-69 Yrs | 396 (11%) | 4475 (10%) | 11244 (9%) | |
70+ Yrs | 216 (6%) | 3269 (7%) | 9179 (7%) | |
Median HH Income | $48,944 | $56,077 | $56,711 | |
Total Household Income | < 24K | 311 (22%) | 3354 (18%) | 8407 (17%) |
25-49K | 391 (28%) | 4539 (24%) | 12704 (26%) | |
50-74K | 288 (20%) | 4227 (22%) | 10396 (21%) | |
75-99K | 287 (20%) | 2371 (12%) | 6730 (13%) | |
100-199K | 95 (6%) | 3547 (19%) | 9042 (18%) | |
200K+ | 5 (0%) | 464 (2%) | 1484 (3%) | |
Highest Education Level | No Diploma | 272 | 2328 | 5624 |
Diploma or GED | 740 | 8030 | 20040 | |
Some College | 533 | 5840 | 16005 | |
Assoc. Degree | 216 | 3811 | 9744 | |
Bachelors Degree | 301 | 5961 | 17094 | |
Higher Degree | 47 | 2473 | 7826 | |
Total Housing Units | 1,447 | 19,822 | 52,485 | |
--Owner-Occupied | 1,050 | 10,663 | 27,559 | |
--Renter-Occupied | 326 | 7,839 | 21,204 | |
Owner-Occupied Values | < 100K | 584 | 2415 | 4302 |
100-199K | 328 | 3682 | 11590 | |
200-299K | 120 | 3015 | 7550 | |
300-399K | 9 | 978 | 2347 | |
400-499K | 9 | 294 | 1095 | |
500K+ | 0 | 280 | 675 | |
Total Working Age Population | 2,709 | 33,699 | 91,474 | |
In Work Force | 1,962 | 25,127 | 67,212 | |
Not In Work Force | 747 | 8,572 | 24,262 | |
Workforce Employed | 1,814 | 24,373 | 65,088 | |
Workforce Unemployed | 148 | 712 | 2,023 | |
Civlian Workforce | 1,961 | 25,085 | 67,110 | |
Military Workforce | 0 | 42 | 101 | |
Total Households | 1,376 | 18,502 | 48,763 | |
Family Households | 825 | 10,789 | 26,579 | |
Non-Family Households | 551 | 7,713 | 22,184 | |
Married Couple | 522 | 7,397 | 18,782 | |
Other Family | 303 | 3,392 | 7,797 | |
Married w/Child | 219 | 3,197 | 8,193 | |
Single Male w/Child | 53 | 470 | 1,110 | |
Single Female w/Child | 105 | 1,760 | 3,845 |
Population Change Last Two Decades - Plus Projection
2000 | % | 2010 | % | 2020 | % | 2030 | |
---|---|---|---|---|---|---|---|
South Dakota | 754,844 | +8 | 814,180 | +9 | 889,447 | +7 | 951,885 |
Minnehaha County | 148,281 | +14 | 169,468 | +12 | 190,105 | +8 | 205,960 |
Lincoln County | 24,131 | +86 | 44,828 | +39 | 62,170 | +27 | 78,966 |
Total Working Age Population:
Total Households:
Total Working Age Population:
Total Households:
Total Working Age Population:
Total Households: