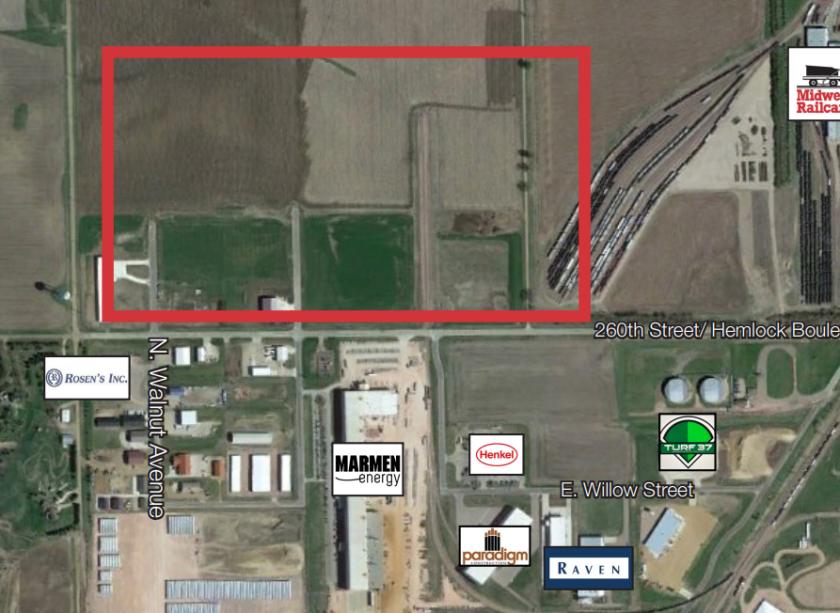
1-Mile | 3-Miles | 5-Miles | ||
---|---|---|---|---|
Total Population | 761 | 8,074 | 13,276 | |
Population Median Age | 35 | 37 | 37 | |
Population by Age | 0-9 Yrs | 111 (14%) | 1285 (15%) | 2062 (15%) |
10-19 Yrs | 134 (17%) | 1169 (14%) | 1895 (14%) | |
20-29 Yrs | 88 (11%) | 678 (8%) | 1005 (7%) | |
30-39 Yrs | 81 (10%) | 1141 (14%) | 1899 (14%) | |
40-49 Yrs | 141 (18%) | 1341 (16%) | 2086 (15%) | |
50-59 Yrs | 90 (11%) | 989 (12%) | 1716 (12%) | |
60-69 Yrs | 61 (8%) | 845 (10%) | 1623 (12%) | |
70+ Yrs | 55 (7%) | 627 (7%) | 990 (7%) | |
Median HH Income | $100,348 | $93,087 | $93,630 | |
Total Household Income | < 24K | 39 (13%) | 221 (7%) | 307 (6%) |
25-49K | 21 (7%) | 509 (16%) | 803 (15%) | |
50-74K | 43 (14%) | 459 (14%) | 732 (14%) | |
75-99K | 40 (13%) | 483 (15%) | 934 (18%) | |
100-199K | 126 (43%) | 1141 (37%) | 1869 (36%) | |
200K+ | 19 (6%) | 264 (8%) | 431 (8%) | |
Highest Education Level | No Diploma | 11 | 114 | 222 |
Diploma or GED | 105 | 1118 | 1801 | |
Some College | 102 | 1181 | 2043 | |
Assoc. Degree | 60 | 675 | 1261 | |
Bachelors Degree | 143 | 1576 | 2495 | |
Higher Degree | 51 | 630 | 1057 | |
Total Housing Units | 301 | 3,226 | 5,302 | |
--Owner-Occupied | 217 | 2,305 | 4,070 | |
--Renter-Occupied | 72 | 771 | 1,007 | |
Owner-Occupied Values | < 100K | 6 | 64 | 172 |
100-199K | 41 | 543 | 969 | |
200-299K | 83 | 835 | 1435 | |
300-399K | 79 | 670 | 1014 | |
400-499K | 5 | 95 | 237 | |
500K+ | 3 | 98 | 242 | |
Total Working Age Population | 567 | 5,959 | 9,841 | |
In Work Force | 458 | 4,726 | 7,802 | |
Not In Work Force | 109 | 1,233 | 2,039 | |
Workforce Employed | 445 | 4,629 | 7,672 | |
Workforce Unemployed | 13 | 84 | 110 | |
Civlian Workforce | 458 | 4,713 | 7,783 | |
Military Workforce | 0 | 13 | 20 | |
Total Households | 289 | 3,075 | 5,076 | |
Family Households | 198 | 2,233 | 3,717 | |
Non-Family Households | 90 | 842 | 1,360 | |
Married Couple | 174 | 1,932 | 3,234 | |
Other Family | 24 | 301 | 482 | |
Married w/Child | 96 | 925 | 1,486 | |
Single Male w/Child | 4 | 68 | 100 | |
Single Female w/Child | 13 | 144 | 234 |
Population Change Last Two Decades - Plus Projection
2000 | % | 2010 | % | 2020 | % | 2030 | |
---|---|---|---|---|---|---|---|
South Dakota | 754,844 | +8 | 814,180 | +9 | 889,447 | +7 | 951,885 |
Minnehaha County | 148,281 | +14 | 169,468 | +12 | 190,105 | +8 | 205,960 |
Total Working Age Population:
Total Households:
Total Working Age Population:
Total Households:
Total Working Age Population:
Total Households: