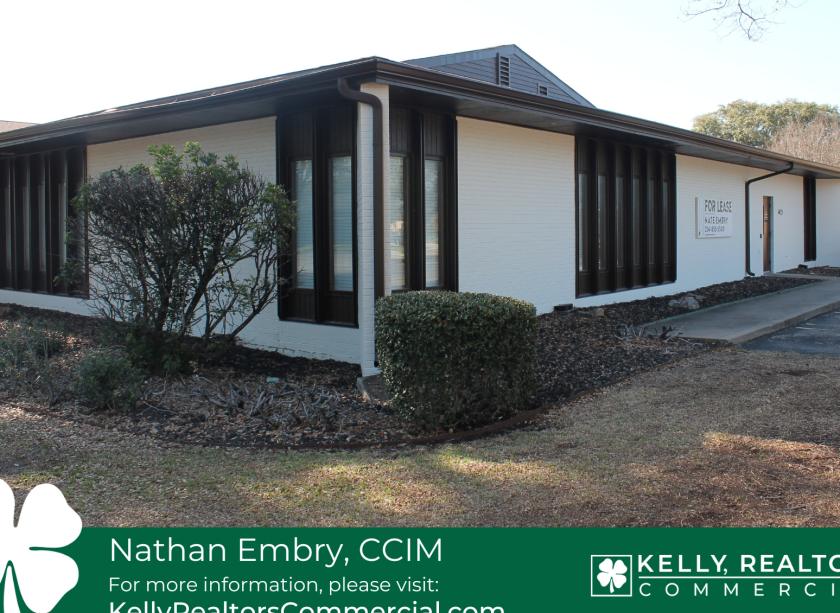
1-Mile | 3-Miles | 5-Miles | ||
---|---|---|---|---|
Total Population | 9,450 | 54,694 | 126,977 | |
Population Median Age | 38 | 38 | 36 | |
Population by Age | 0-9 Yrs | 1293 (13%) | 8031 (14%) | 17796 (14%) |
10-19 Yrs | 977 (10%) | 6859 (12%) | 18444 (14%) | |
20-29 Yrs | 1776 (18%) | 8689 (15%) | 23600 (18%) | |
30-39 Yrs | 1349 (14%) | 7174 (13%) | 15921 (12%) | |
40-49 Yrs | 1025 (10%) | 5468 (9%) | 12787 (10%) | |
50-59 Yrs | 930 (9%) | 5892 (10%) | 13723 (10%) | |
60-69 Yrs | 1005 (10%) | 5825 (10%) | 11965 (9%) | |
70+ Yrs | 1096 (11%) | 6754 (12%) | 12741 (10%) | |
Median HH Income | $38,556 | $48,441 | $44,889 | |
Total Household Income | < 24K | 1229 (30%) | 5109 (24%) | 13304 (27%) |
25-49K | 1157 (28%) | 5776 (27%) | 12612 (26%) | |
50-74K | 709 (17%) | 3312 (15%) | 7144 (15%) | |
75-99K | 420 (10%) | 2510 (11%) | 5268 (11%) | |
100-199K | 461 (11%) | 3555 (16%) | 7430 (15%) | |
200K+ | 44 (1%) | 952 (4%) | 1767 (3%) | |
Highest Education Level | No Diploma | 752 | 5166 | 12535 |
Diploma or GED | 1847 | 9131 | 19868 | |
Some College | 1648 | 8004 | 17295 | |
Assoc. Degree | 581 | 3118 | 6781 | |
Bachelors Degree | 878 | 6579 | 12774 | |
Higher Degree | 510 | 3879 | 7867 | |
Total Housing Units | 4,742 | 23,658 | 52,980 | |
--Owner-Occupied | 1,367 | 11,586 | 24,823 | |
--Renter-Occupied | 2,654 | 9,627 | 22,701 | |
Owner-Occupied Values | < 100K | 417 | 3637 | 8887 |
100-199K | 752 | 4310 | 8668 | |
200-299K | 118 | 2381 | 4772 | |
300-399K | 38 | 601 | 1256 | |
400-499K | 16 | 270 | 577 | |
500K+ | 27 | 388 | 664 | |
Total Working Age Population | 7,547 | 42,079 | 97,949 | |
In Work Force | 5,025 | 26,675 | 61,348 | |
Not In Work Force | 2,522 | 15,405 | 36,601 | |
Workforce Employed | 4,741 | 25,391 | 58,538 | |
Workforce Unemployed | 284 | 1,281 | 2,712 | |
Civlian Workforce | 5,025 | 26,672 | 61,250 | |
Military Workforce | 0 | 3 | 97 | |
Total Households | 4,021 | 21,213 | 47,524 | |
Family Households | 2,198 | 13,471 | 29,289 | |
Non-Family Households | 1,823 | 7,743 | 18,235 | |
Married Couple | 1,323 | 9,439 | 19,705 | |
Other Family | 876 | 4,031 | 9,584 | |
Married w/Child | 315 | 3,592 | 8,180 | |
Single Male w/Child | 112 | 402 | 801 | |
Single Female w/Child | 378 | 1,598 | 4,295 |
Population Change Last Two Decades - Plus Projection
2000 | % | 2010 | % | 2020 | % | 2030 | |
---|---|---|---|---|---|---|---|
Texas | 20,851,820 | +21 | 25,145,561 | +18 | 29,677,668 | +18 | 34,894,452 |
McLennan County | 213,517 | +10 | 234,906 | +8 | 253,066 | +6 | 269,381 |
Total Working Age Population:
Total Households:
Total Working Age Population:
Total Households:
Total Working Age Population:
Total Households: