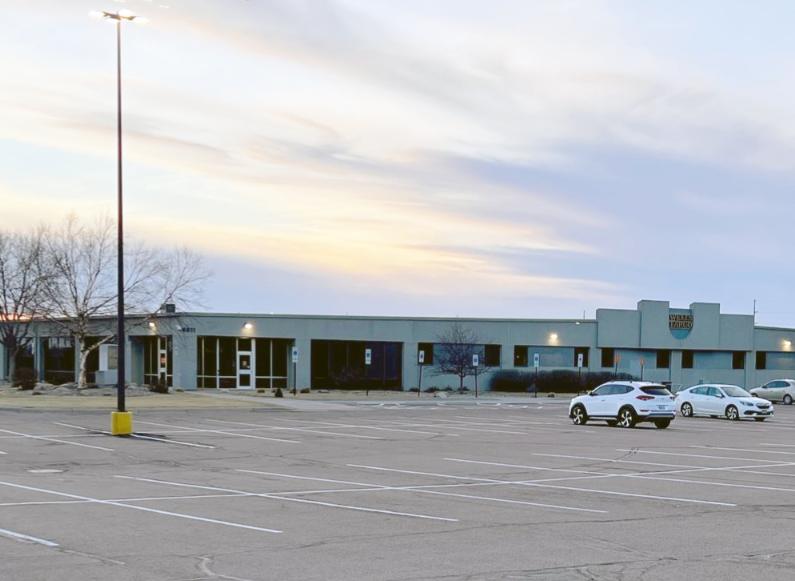
Office Space
4811 North 4th Avenue Sioux Falls, SD 57104
4811 North 4th Avenue Sioux Falls, SD 57104
Details & Description
Property Highlights
- • Land to building ratio: 19%
- • Zoning: Industrial I-1
- • Years built: 1988-1999
- • Built in 3 phases
- • Approximately 550 surface parking spaces
- • 10’ finished ceilings
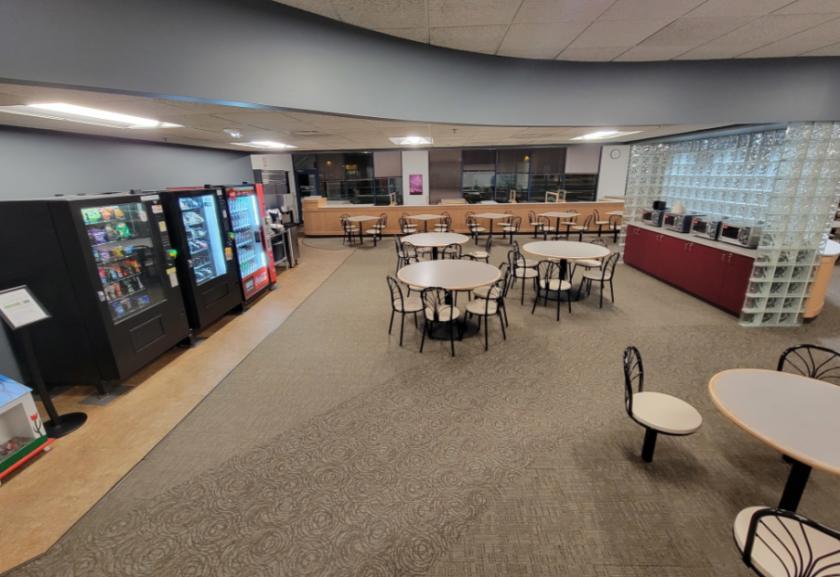
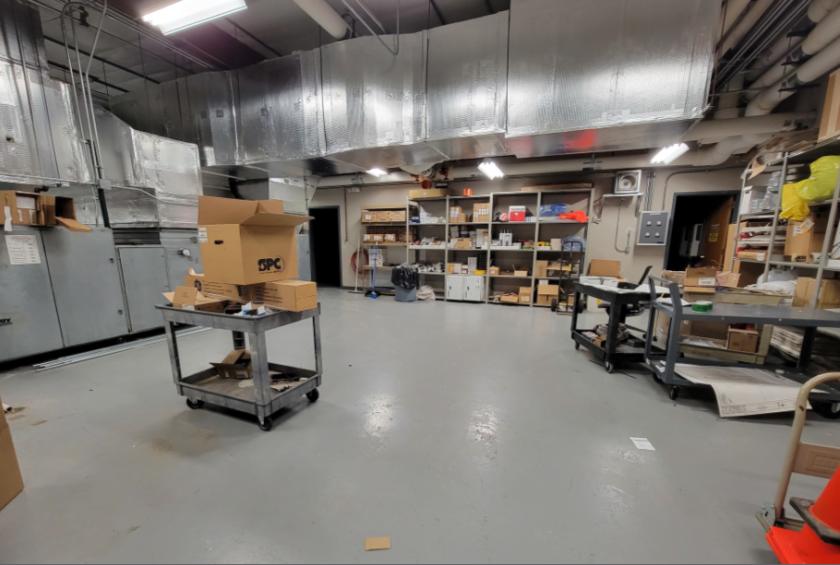
Additional Photos


Listing Agents

Craig Hagen
O: 605-357-7100
M: 605-310-4227
chagen@naisiouxfalls.com
O: 605-357-7100
M: 605-310-4227
chagen@naisiouxfalls.com
While we strive to provide the most accurate information, all listing information, and demographic data, is provided by third-parties. As such, MyEListing will not be responsible for the accuracy of the information. It is strongly recommended that you verify all information with the listing agent, and any relevant agencies, prior to making any decisions.