Retail Space
37 East Genesee Street Auburn, NY 13021
37 East Genesee Street Auburn, NY 13021

Details & Description
Property Highlights
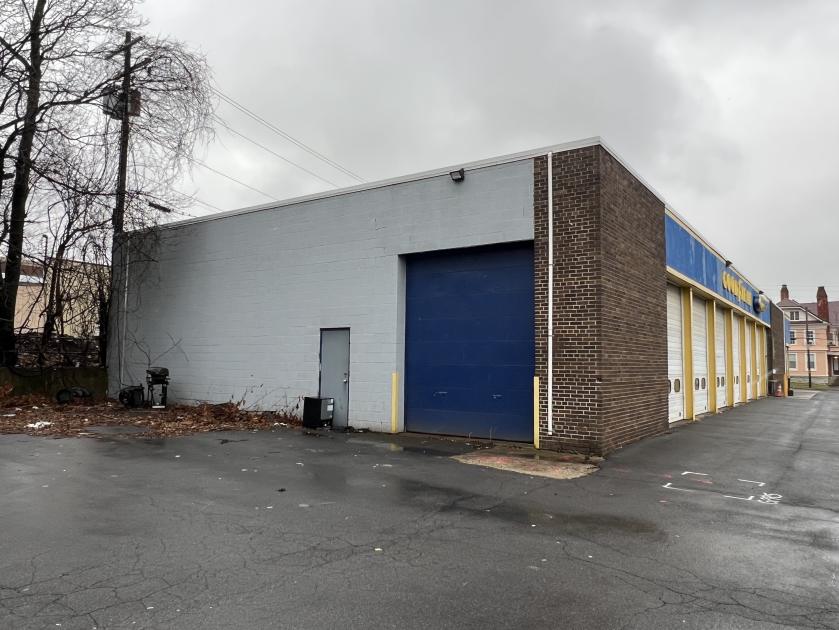
- • High Visibility
- • Easy Access
- • High Ceilings
- • (7) 12' Drive-in Doors
Additional Photos


Listing Agents

Michael Conroy
O: 585-735-7739
M: 585-802-3327
michael.conroy@expcommercial.com
O: 585-735-7739
M: 585-802-3327
michael.conroy@expcommercial.com
While we strive to provide the most accurate information, all listing information, and demographic data, is provided by third-parties. As such, MyEListing will not be responsible for the accuracy of the information. It is strongly recommended that you verify all information with the listing agent, and any relevant agencies, prior to making any decisions.


