Flex-Office-Warehouse
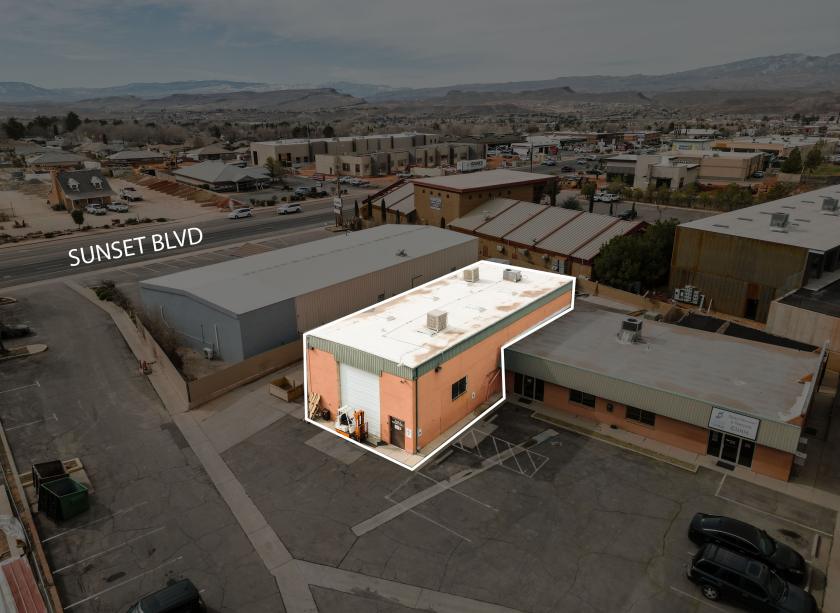
1192 West Sunset Boulevard St George, UT 84770
1192 West Sunset Boulevard St George, UT 84770
Details & Description
Property Highlights
- • Excellent Location
- • High Traffic
- • Easy access to Sunset Blvd
- • Warehouse & Office
Listing Agents

Brandon Vandermyde
O: 435-628-1609
brandonv@excelcres.com
O: 435-628-1609
brandonv@excelcres.com
While we strive to provide the most accurate information, all listing information, and demographic data, is provided by third-parties. As such, MyEListing will not be responsible for the accuracy of the information. It is strongly recommended that you verify all information with the listing agent, and any relevant agencies, prior to making any decisions.

