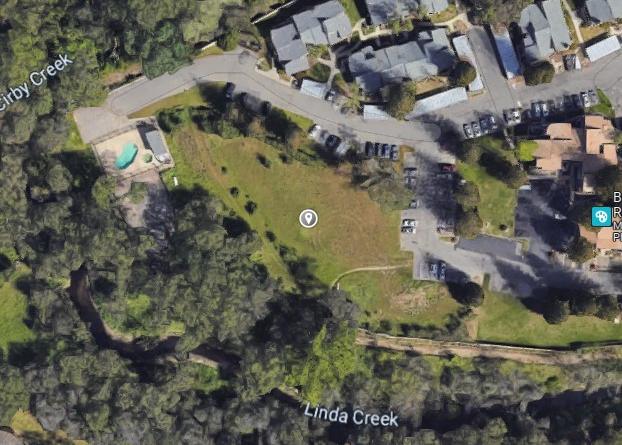
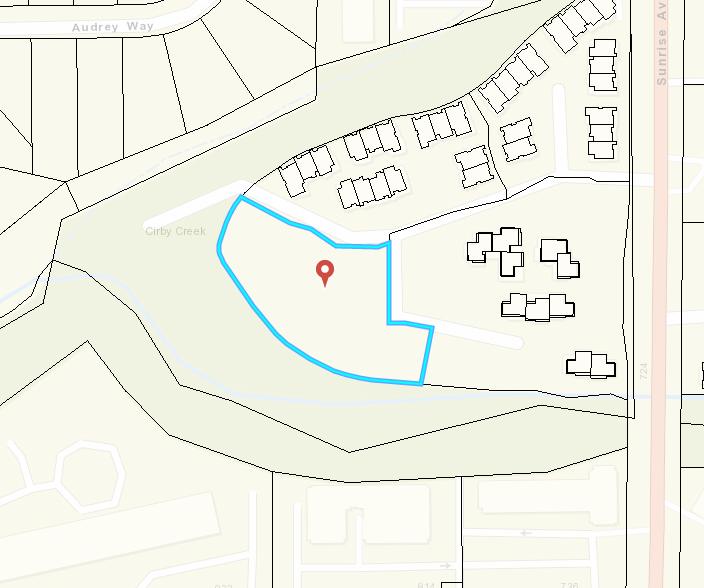
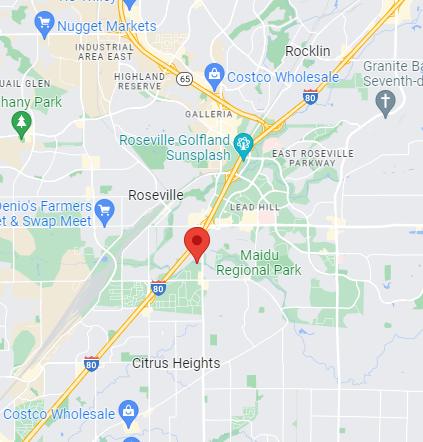
1-Mile | 3-Miles | 5-Miles | ||
---|---|---|---|---|
Total Population | 13,740 | 109,095 | 304,007 | |
Population Median Age | 43 | 40 | 39 | |
Population by Age | 0-9 Yrs | 1790 (13%) | 11453 (10%) | 34729 (11%) |
10-19 Yrs | 1074 (7%) | 12852 (11%) | 40690 (13%) | |
20-29 Yrs | 1548 (11%) | 15350 (14%) | 40808 (13%) | |
30-39 Yrs | 1774 (12%) | 15366 (14%) | 42548 (13%) | |
40-49 Yrs | 1580 (11%) | 13390 (12%) | 37741 (12%) | |
50-59 Yrs | 1829 (13%) | 15163 (13%) | 42180 (13%) | |
60-69 Yrs | 1589 (11%) | 13505 (12%) | 34010 (11%) | |
70+ Yrs | 2556 (18%) | 12017 (11%) | 31300 (10%) | |
Median HH Income | $67,115 | $78,621 | $81,144 | |
Total Household Income | < 24K | 914 (16%) | 5240 (12%) | 13969 (12%) |
25-49K | 1111 (20%) | 7226 (17%) | 18294 (16%) | |
50-74K | 1059 (19%) | 7665 (18%) | 19804 (17%) | |
75-99K | 730 (13%) | 6289 (14%) | 16560 (14%) | |
100-199K | 1366 (24%) | 11981 (28%) | 32274 (28%) | |
200K+ | 311 (5%) | 3683 (8%) | 11375 (10%) | |
Highest Education Level | No Diploma | 728 | 5001 | 14241 |
Diploma or GED | 2275 | 16283 | 42952 | |
Some College | 2830 | 22704 | 58371 | |
Assoc. Degree | 1134 | 8404 | 23613 | |
Bachelors Degree | 2216 | 18191 | 48576 | |
Higher Degree | 1015 | 7489 | 22294 | |
Total Housing Units | 5,954 | 43,877 | 116,636 | |
--Owner-Occupied | 3,170 | 26,432 | 72,423 | |
--Renter-Occupied | 2,322 | 15,652 | 39,851 | |
Owner-Occupied Values | < 100K | 55 | 1016 | 3183 |
100-199K | 140 | 1051 | 2796 | |
200-299K | 382 | 3929 | 9651 | |
300-399K | 1045 | 8736 | 22027 | |
400-499K | 837 | 5645 | 15422 | |
500K+ | 710 | 6055 | 19344 | |
Total Working Age Population | 11,190 | 89,642 | 244,308 | |
In Work Force | 5,962 | 57,216 | 158,039 | |
Not In Work Force | 5,227 | 32,425 | 86,270 | |
Workforce Employed | 5,735 | 54,271 | 149,038 | |
Workforce Unemployed | 209 | 2,844 | 8,497 | |
Civlian Workforce | 5,944 | 57,115 | 157,535 | |
Military Workforce | 18 | 102 | 503 | |
Total Households | 5,491 | 42,084 | 112,275 | |
Family Households | 3,265 | 27,898 | 76,605 | |
Non-Family Households | 2,227 | 14,186 | 35,670 | |
Married Couple | 2,507 | 20,467 | 57,657 | |
Other Family | 758 | 7,431 | 18,948 | |
Married w/Child | 981 | 7,574 | 24,406 | |
Single Male w/Child | 67 | 1,325 | 2,971 | |
Single Female w/Child | 238 | 2,267 | 6,230 |
Population Change Last Two Decades - Plus Projection
2000 | % | 2010 | % | 2020 | % | 2030 | |
---|---|---|---|---|---|---|---|
California | 33,871,648 | +10 | 37,253,956 | +9 | 40,467,295 | +8 | 43,631,295 |
Sacramento County | 1,223,499 | +16 | 1,418,788 | +11 | 1,572,195 | +12 | 1,758,565 |
Placer County | 248,399 | +40 | 348,432 | +15 | 399,388 | +14 | 456,175 |
Total Working Age Population:
Total Households:
Total Working Age Population:
Total Households:
Total Working Age Population:
Total Households: