Industrial Properties
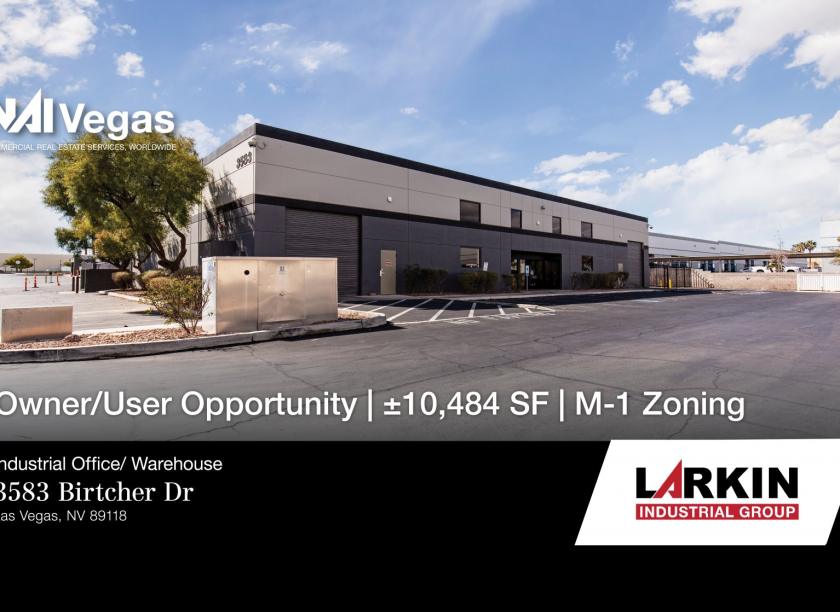
3583 Birtcher Drive Las Vegas, NV 89118
3583 Birtcher Drive Las Vegas, NV 89118
Details & Description
Property Highlights
- • Two Story Office ±2,977 SF
- • Concrete Tilt-Up (1997)
- • Warehouse Skylights
- • 18’ Clear Height
- • 3-Phase, 277/480V, 400 Amps
- • Solar Panels on Roof
Additional Photos


Listing Agents

Leslie Houston
O: 702-383-3383
M: 702-534-1705
lhouston@naiexcel.com
O: 702-383-3383
M: 702-534-1705
lhouston@naiexcel.com
While we strive to provide the most accurate information, all listing information, and demographic data, is provided by third-parties. As such, MyEListing will not be responsible for the accuracy of the information. It is strongly recommended that you verify all information with the listing agent, and any relevant agencies, prior to making any decisions.