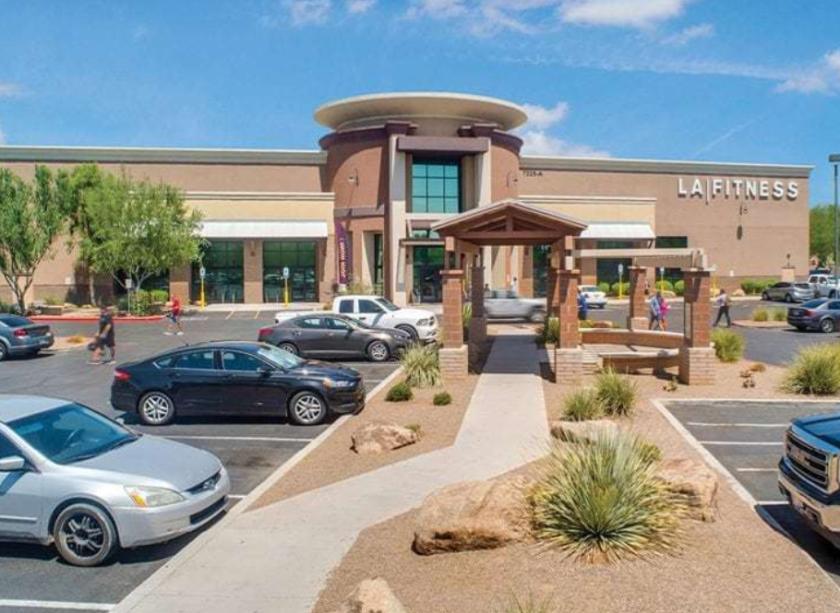
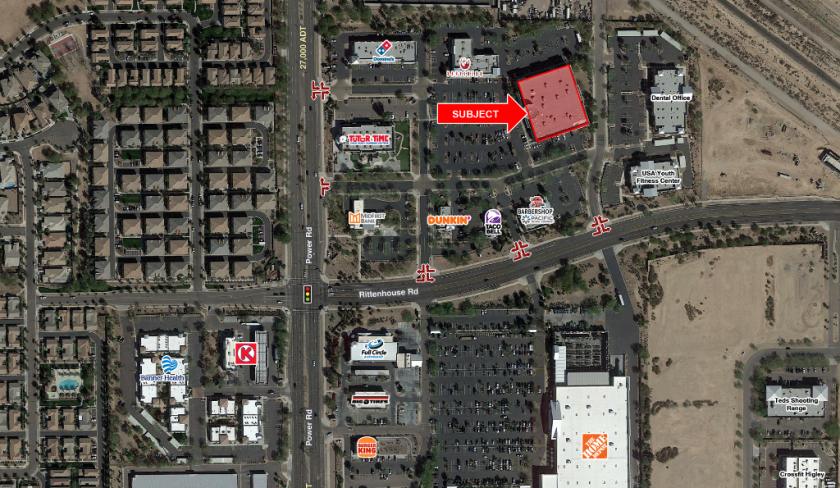
1-Mile | 3-Miles | 5-Miles | ||
---|---|---|---|---|
Total Population | 10,502 | 73,239 | 167,602 | |
Population Median Age | 30 | 33 | 33 | |
Population by Age | 0-9 Yrs | 1973 (18%) | 12628 (17%) | 27249 (16%) |
10-19 Yrs | 2293 (21%) | 13805 (18%) | 31670 (18%) | |
20-29 Yrs | 1211 (11%) | 7946 (10%) | 17244 (10%) | |
30-39 Yrs | 1522 (14%) | 11081 (15%) | 24981 (14%) | |
40-49 Yrs | 1664 (15%) | 11521 (15%) | 27583 (16%) | |
50-59 Yrs | 629 (5%) | 6575 (8%) | 17621 (10%) | |
60-69 Yrs | 756 (7%) | 5236 (7%) | 11515 (6%) | |
70+ Yrs | 454 (4%) | 4447 (6%) | 9739 (5%) | |
Median HH Income | $91,092 | $101,848 | $101,917 | |
Total Household Income | < 24K | 328 (10%) | 1729 (7%) | 3437 (6%) |
25-49K | 377 (12%) | 2599 (11%) | 6114 (11%) | |
50-74K | 465 (15%) | 3211 (14%) | 8132 (15%) | |
75-99K | 531 (17%) | 3353 (15%) | 7698 (14%) | |
100-199K | 1079 (35%) | 8713 (39%) | 19623 (37%) | |
200K+ | 243 (8%) | 2646 (11%) | 6856 (13%) | |
Highest Education Level | No Diploma | 153 | 1200 | 3415 |
Diploma or GED | 1135 | 6784 | 16366 | |
Some College | 1252 | 10975 | 25573 | |
Assoc. Degree | 662 | 4510 | 10383 | |
Bachelors Degree | 1696 | 12928 | 29318 | |
Higher Degree | 608 | 6107 | 14509 | |
Total Housing Units | 3,418 | 23,984 | 55,539 | |
--Owner-Occupied | 1,993 | 17,136 | 39,529 | |
--Renter-Occupied | 1,030 | 5,116 | 12,329 | |
Owner-Occupied Values | < 100K | 16 | 194 | 641 |
100-199K | 34 | 484 | 1260 | |
200-299K | 690 | 4429 | 9594 | |
300-399K | 683 | 6277 | 13616 | |
400-499K | 345 | 3230 | 8165 | |
500K+ | 226 | 2523 | 6252 | |
Total Working Age Population | 7,203 | 51,983 | 121,024 | |
In Work Force | 4,929 | 36,481 | 86,098 | |
Not In Work Force | 2,274 | 15,501 | 34,925 | |
Workforce Employed | 4,746 | 34,942 | 82,518 | |
Workforce Unemployed | 178 | 1,480 | 3,493 | |
Civlian Workforce | 4,924 | 36,422 | 86,011 | |
Military Workforce | 5 | 59 | 87 | |
Total Households | 3,023 | 22,252 | 51,859 | |
Family Households | 2,398 | 17,652 | 40,868 | |
Non-Family Households | 624 | 4,600 | 10,991 | |
Married Couple | 1,860 | 14,815 | 33,393 | |
Other Family | 539 | 2,837 | 7,475 | |
Married w/Child | 1,234 | 8,527 | 18,988 | |
Single Male w/Child | 100 | 610 | 1,395 | |
Single Female w/Child | 305 | 1,379 | 3,270 |
Population Change Last Two Decades - Plus Projection
2000 | % | 2010 | % | 2020 | % | 2030 | |
---|---|---|---|---|---|---|---|
Arizona | 5,130,632 | +25 | 6,392,017 | +14 | 7,286,100 | +14 | 8,284,900 |
Maricopa County | 3,072,149 | +24 | 3,817,117 | +16 | 4,436,900 | +15 | 5,107,700 |
Total Working Age Population:
Total Households:
Total Working Age Population:
Total Households:
Total Working Age Population:
Total Households: