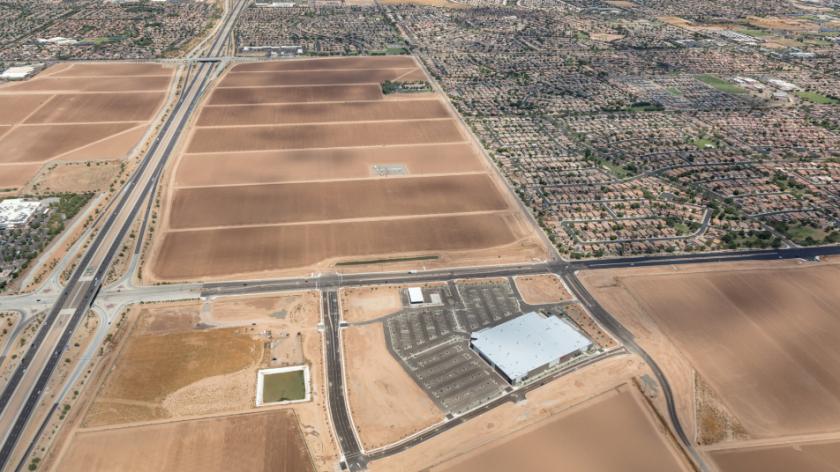
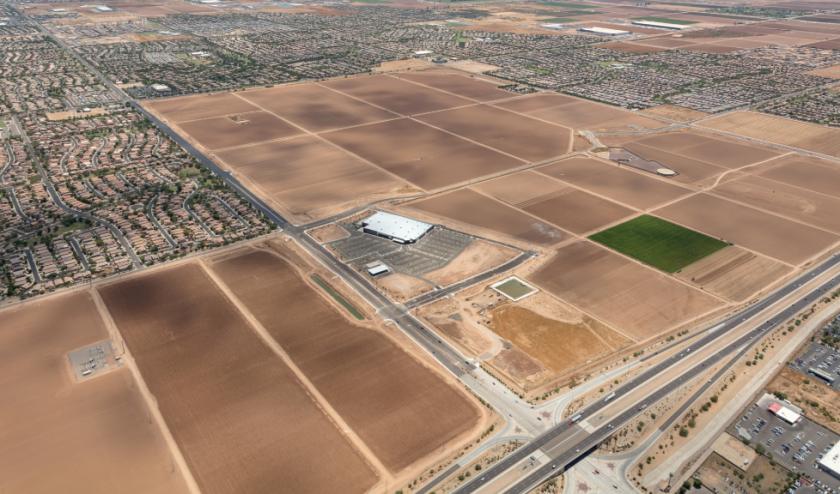
1-Mile | 3-Miles | 5-Miles | ||
---|---|---|---|---|
Total Population | 5,800 | 88,113 | 163,348 | |
Population Median Age | 34 | 37 | 42 | |
Population by Age | 0-9 Yrs | 712 (12%) | 12133 (13%) | 18869 (11%) |
10-19 Yrs | 1113 (19%) | 16226 (18%) | 24373 (14%) | |
20-29 Yrs | 850 (14%) | 8316 (9%) | 15356 (9%) | |
30-39 Yrs | 683 (11%) | 10889 (12%) | 18204 (11%) | |
40-49 Yrs | 932 (16%) | 13439 (15%) | 21483 (13%) | |
50-59 Yrs | 810 (13%) | 9914 (11%) | 17926 (10%) | |
60-69 Yrs | 388 (6%) | 8145 (9%) | 17792 (10%) | |
70+ Yrs | 313 (5%) | 9049 (10%) | 29346 (17%) | |
Median HH Income | $85,926 | $78,527 | $71,103 | |
Total Household Income | < 24K | 111 (6%) | 2249 (8%) | 6320 (10%) |
25-49K | 226 (12%) | 5093 (18%) | 12161 (20%) | |
50-74K | 415 (23%) | 5867 (21%) | 12851 (21%) | |
75-99K | 269 (15%) | 4931 (17%) | 9977 (16%) | |
100-199K | 673 (38%) | 8449 (30%) | 15052 (25%) | |
200K+ | 45 (2%) | 1221 (4%) | 2370 (4%) | |
Highest Education Level | No Diploma | 193 | 3598 | 9136 |
Diploma or GED | 1116 | 14719 | 29013 | |
Some College | 1027 | 15374 | 31286 | |
Assoc. Degree | 341 | 5669 | 11324 | |
Bachelors Degree | 581 | 10505 | 20602 | |
Higher Degree | 200 | 5475 | 11224 | |
Total Housing Units | 1,786 | 30,571 | 65,745 | |
--Owner-Occupied | 1,228 | 21,446 | 44,766 | |
--Renter-Occupied | 512 | 6,364 | 13,965 | |
Owner-Occupied Values | < 100K | 5 | 455 | 1572 |
100-199K | 234 | 3814 | 10026 | |
200-299K | 811 | 10130 | 18846 | |
300-399K | 146 | 5260 | 9631 | |
400-499K | 24 | 1351 | 3065 | |
500K+ | 9 | 435 | 1627 | |
Total Working Age Population | 4,316 | 65,431 | 128,502 | |
In Work Force | 3,048 | 40,753 | 70,059 | |
Not In Work Force | 1,268 | 24,678 | 58,444 | |
Workforce Employed | 2,812 | 38,239 | 65,646 | |
Workforce Unemployed | 196 | 1,716 | 3,246 | |
Civlian Workforce | 3,008 | 39,956 | 68,893 | |
Military Workforce | 40 | 797 | 1,166 | |
Total Households | 1,740 | 27,810 | 58,731 | |
Family Households | 1,456 | 22,835 | 44,401 | |
Non-Family Households | 284 | 4,974 | 14,330 | |
Married Couple | 1,248 | 18,918 | 36,504 | |
Other Family | 209 | 3,918 | 7,897 | |
Married w/Child | 642 | 8,600 | 13,173 | |
Single Male w/Child | 6 | 538 | 959 | |
Single Female w/Child | 135 | 1,712 | 3,019 |
Population Change Last Two Decades - Plus Projection
2000 | % | 2010 | % | 2020 | % | 2030 | |
---|---|---|---|---|---|---|---|
Arizona | 5,130,632 | +25 | 6,392,017 | +14 | 7,286,100 | +14 | 8,284,900 |
Maricopa County | 3,072,149 | +24 | 3,817,117 | +16 | 4,436,900 | +15 | 5,107,700 |
Total Working Age Population:
Total Households:
Total Working Age Population:
Total Households:
Total Working Age Population:
Total Households: