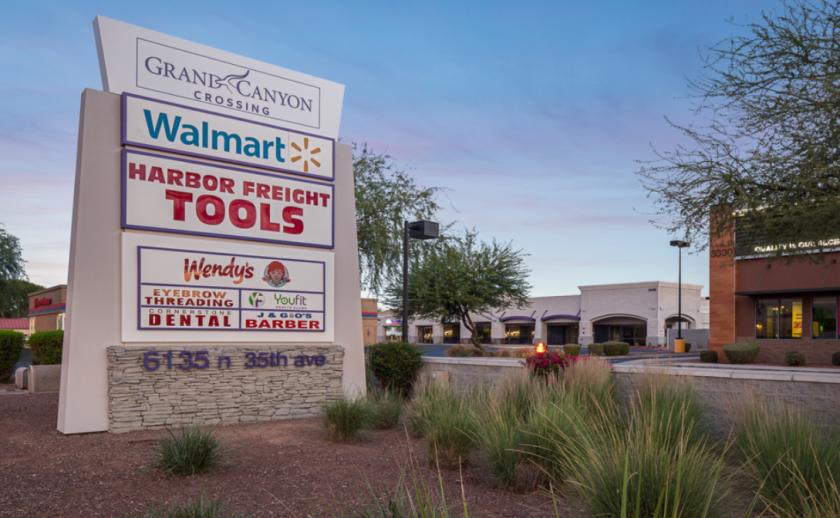
Retail Space
6135 and 6145 N 35th Ave Phoenix, AZ 85017
6135 and 6145 N 35th Ave Phoenix, AZ 85017

Details & Description
Property Highlights
• High density trade zone with over 200,000 people in a three mile radius
• Complimentary mix of in-line and outparcel tenants
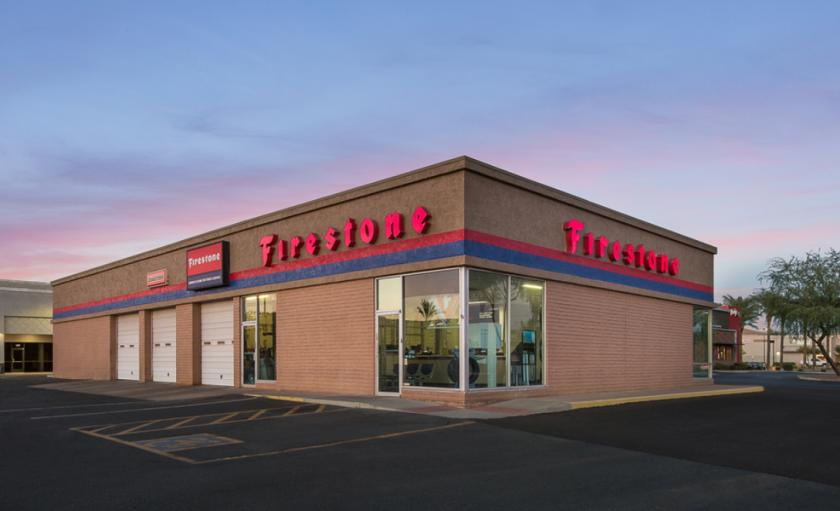
Additional Photos


Listing Agents

Jason Fessinger
O: 602-368-1090
jfessinger@w-retail.com
O: 602-368-1090
jfessinger@w-retail.com

Kalen Rickard
O: 602-931-4492
krickard@w-retail.com
O: 602-931-4492
krickard@w-retail.com

Julie Green
Western Retail Advisors
O: 602-710-1786
jgreen@w-retail.com
Western Retail Advisors
O: 602-710-1786
jgreen@w-retail.com
While we strive to provide the most accurate information, all listing information, and demographic data, is provided by third-parties. As such, MyEListing will not be responsible for the accuracy of the information. It is strongly recommended that you verify all information with the listing agent, and any relevant agencies, prior to making any decisions.