$1.00 per sq ft per month
1,000 sq ft minimum per month
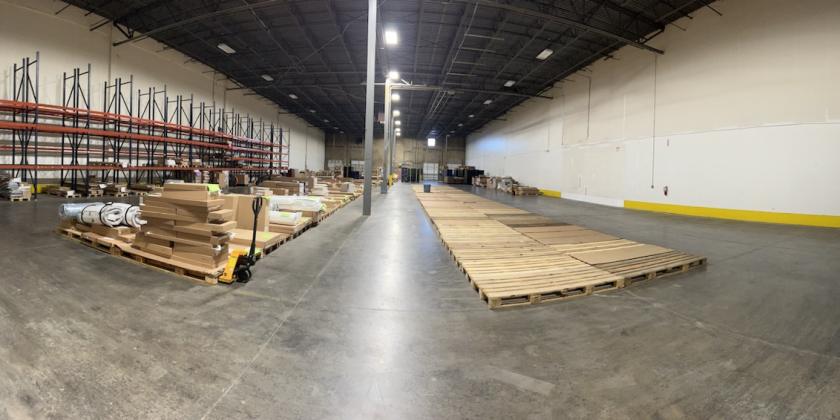
10,000 total sq ft available for rent
- This warehouse allows general storage
- PERFECT FOR HANDS-OFF ECCOMERCE BUSINESS
- DROPSHIPPING
- PICK & PACK
Clean, safe and secure warehouse
Efficient warehousing operation
Inventory management
- This is a shared space warehouse
- No public access allowed
- DOES NOT ALLOW IN WAREHOUSE LABOR OF ANY KIND INSIDE
This means businesses cannot work in the space
Book a tour or view full warehouse details here: https://www.warehouseexchange.com/warehouse/1142
If you are interested in this facility please fill out the form below, it is sent directly to me. I will have the tenant manager respond back to you to book a tour to see the space and discuss pricing: https://share.hsforms.com/1ZK3ynKGAQb6AkLKipzmcUQbvwy5
Search warehouses for rent across the USA and book a tour or reserve warehouse space today, just visit www.warehouseexchange.com.
No part of this information may be copied, reproduced, repurposed, or screen-captured for any commercial purpose without prior written authorization from MyEListing.
While we strive to provide the most accurate information, all listing information, and demographic data, is provided by third-parties. As such, MyEListing will not be responsible for the accuracy of the information. It is strongly recommended that you verify all information with the listing agent, and any relevant agencies, prior to making any decisions.
What is the building size of this commercial Industrial property?
The size of this multi-unit property varies between 1000 - 10000 square feet
What kind of Industrial is the propery at 6965 Northpark Boulevard?
The property at 6965 Northpark Boulevard Charlotte, NC 28216 is listed as a Warehouse Industrial property
What is the population within 1 mile of 6965 Northpark Boulevard in Charlotte?
The population within 1 mile of 6965 Northpark Boulevard Charlotte, NC 28216 is 5,692 people.
Who do I contact for questions about 6965 Northpark Boulevard?
You should contact the listing agent,
Warehouse Exchange, for any details regarding this commercial listing.