Retail Space
8901 East McDonald Drive Scottsdale, AZ 85250
8901 East McDonald Drive Scottsdale, AZ 85250
Details & Description
Property Highlights
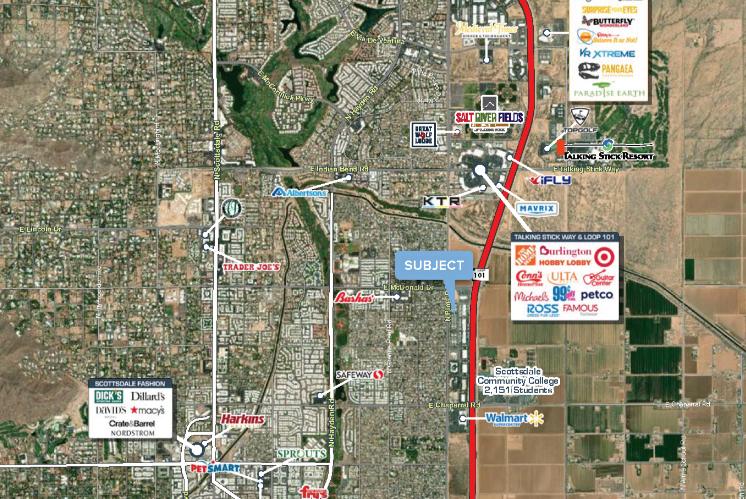
- • New Retail Shops for Lease in Scottsdale
- • Join National Coffee Tenant
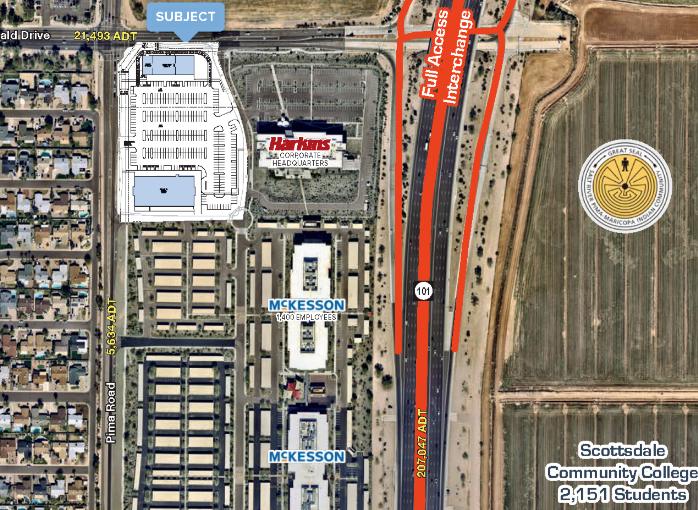
- • Dense Daytime Population
- • Great access and exposure to the Loop 101
- • Space Available 1,200 - 9,000 SF Divisible
Listing Agents

Ryan Desmond
O: 602-931-4489
rdesmond@w-retail.com
O: 602-931-4489
rdesmond@w-retail.com

Katie Weeks
O: 602-368-1372
kweeks@w-retail.com
O: 602-368-1372
kweeks@w-retail.com
While we strive to provide the most accurate information, all listing information, and demographic data, is provided by third-parties. As such, MyEListing will not be responsible for the accuracy of the information. It is strongly recommended that you verify all information with the listing agent, and any relevant agencies, prior to making any decisions.