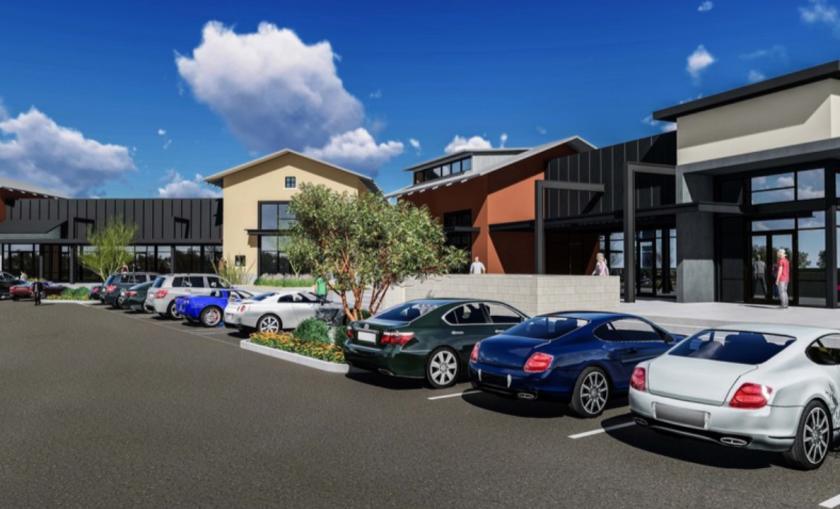
1-Mile | 3-Miles | 5-Miles | ||
---|---|---|---|---|
Total Population | 3,717 | 63,712 | 152,128 | |
Population Median Age | 35 | 36 | 40 | |
Population by Age | 0-9 Yrs | 442 (11%) | 8906 (13%) | 18265 (12%) |
10-19 Yrs | 937 (25%) | 10971 (17%) | 21589 (14%) | |
20-29 Yrs | 250 (6%) | 5730 (8%) | 14877 (9%) | |
30-39 Yrs | 244 (6%) | 8108 (12%) | 17497 (11%) | |
40-49 Yrs | 780 (20%) | 10158 (15%) | 21253 (13%) | |
50-59 Yrs | 626 (16%) | 8501 (13%) | 21021 (13%) | |
60-69 Yrs | 312 (8%) | 7226 (11%) | 19194 (12%) | |
70+ Yrs | 127 (3%) | 4112 (6%) | 18431 (12%) | |
Median HH Income | $143,502 | $117,891 | $94,607 | |
Total Household Income | < 24K | 49 (5%) | 1138 (5%) | 5714 (10%) |
25-49K | 43 (4%) | 1609 (8%) | 6893 (12%) | |
50-74K | 144 (16%) | 2726 (13%) | 8779 (16%) | |
75-99K | 72 (8%) | 2507 (12%) | 7436 (13%) | |
100-199K | 287 (32%) | 8094 (41%) | 18592 (34%) | |
200K+ | 286 (32%) | 3525 (17%) | 7023 (12%) | |
Highest Education Level | No Diploma | 45 | 2239 | 4703 |
Diploma or GED | 303 | 6383 | 19363 | |
Some College | 586 | 8716 | 24927 | |
Assoc. Degree | 426 | 4901 | 10895 | |
Bachelors Degree | 461 | 11613 | 27752 | |
Higher Degree | 406 | 7115 | 17576 | |
Total Housing Units | 923 | 20,347 | 58,852 | |
--Owner-Occupied | 836 | 17,122 | 43,876 | |
--Renter-Occupied | 45 | 2,477 | 10,561 | |
Owner-Occupied Values | < 100K | 43 | 224 | 1006 |
100-199K | 4 | 365 | 3324 | |
200-299K | 29 | 3004 | 11777 | |
300-399K | 135 | 6148 | 13514 | |
400-499K | 188 | 4087 | 7311 | |
500K+ | 437 | 3294 | 6944 | |
Total Working Age Population | 2,449 | 46,928 | 119,364 | |
In Work Force | 1,732 | 32,912 | 75,879 | |
Not In Work Force | 717 | 14,016 | 43,485 | |
Workforce Employed | 1,702 | 31,787 | 73,081 | |
Workforce Unemployed | 30 | 1,077 | 2,686 | |
Civlian Workforce | 1,732 | 32,864 | 75,767 | |
Military Workforce | 0 | 48 | 112 | |
Total Households | 882 | 19,599 | 54,437 | |
Family Households | 832 | 16,630 | 40,798 | |
Non-Family Households | 49 | 2,969 | 13,639 | |
Married Couple | 713 | 14,417 | 34,371 | |
Other Family | 119 | 2,213 | 6,427 | |
Married w/Child | 282 | 7,011 | 13,989 | |
Single Male w/Child | 66 | 564 | 1,270 | |
Single Female w/Child | 2 | 655 | 1,954 |
Population Change Last Two Decades - Plus Projection
2000 | % | 2010 | % | 2020 | % | 2030 | |
---|---|---|---|---|---|---|---|
Arizona | 5,130,632 | +25 | 6,392,017 | +14 | 7,286,100 | +14 | 8,284,900 |
Maricopa County | 3,072,149 | +24 | 3,817,117 | +16 | 4,436,900 | +15 | 5,107,700 |
Total Working Age Population:
Total Households:
Total Working Age Population:
Total Households:
Total Working Age Population:
Total Households: