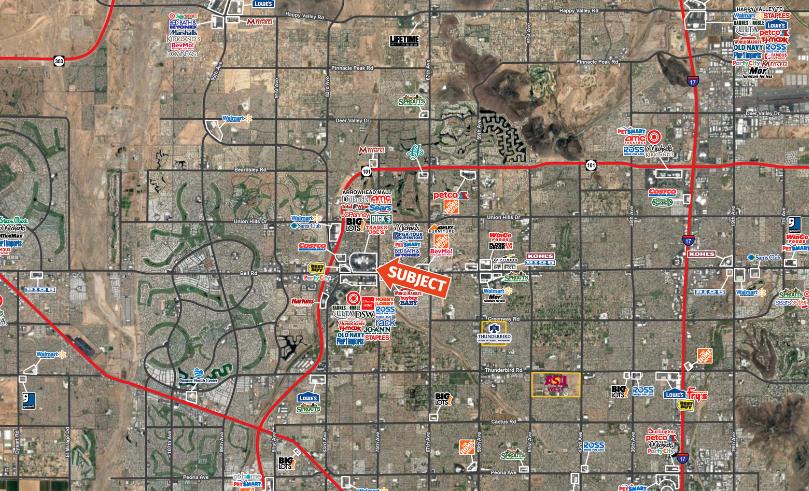
1-Mile | 3-Miles | 5-Miles | ||
---|---|---|---|---|
Total Population | 9,482 | 104,540 | 277,008 | |
Population Median Age | 40 | 43 | 43 | |
Population by Age | 0-9 Yrs | 896 (9%) | 9617 (9%) | 27336 (9%) |
10-19 Yrs | 1079 (11%) | 11278 (10%) | 31950 (11%) | |
20-29 Yrs | 1641 (17%) | 13549 (12%) | 33183 (11%) | |
30-39 Yrs | 1243 (13%) | 12021 (11%) | 30961 (11%) | |
40-49 Yrs | 1139 (12%) | 12204 (11%) | 31602 (11%) | |
50-59 Yrs | 1413 (14%) | 15009 (14%) | 36968 (13%) | |
60-69 Yrs | 1091 (11%) | 14293 (13%) | 37505 (13%) | |
70+ Yrs | 981 (10%) | 16568 (15%) | 47501 (17%) | |
Median HH Income | $67,468 | $73,894 | $66,966 | |
Total Household Income | < 24K | 626 (15%) | 5917 (14%) | 16681 (15%) |
25-49K | 597 (14%) | 7623 (18%) | 22911 (21%) | |
50-74K | 1069 (26%) | 7673 (18%) | 20687 (19%) | |
75-99K | 587 (14%) | 6460 (15%) | 16002 (14%) | |
100-199K | 962 (23%) | 11489 (27%) | 26060 (24%) | |
200K+ | 193 (4%) | 2647 (6%) | 6032 (5%) | |
Highest Education Level | No Diploma | 427 | 4558 | 15477 |
Diploma or GED | 1806 | 19223 | 52432 | |
Some College | 1457 | 18918 | 52271 | |
Assoc. Degree | 585 | 7801 | 20743 | |
Bachelors Degree | 1506 | 16861 | 38705 | |
Higher Degree | 893 | 9637 | 21989 | |
Total Housing Units | 4,478 | 46,293 | 119,753 | |
--Owner-Occupied | 1,742 | 29,278 | 78,715 | |
--Renter-Occupied | 2,293 | 12,531 | 29,658 | |
Owner-Occupied Values | < 100K | 46 | 1017 | 6457 |
100-199K | 242 | 5677 | 19285 | |
200-299K | 491 | 10715 | 28177 | |
300-399K | 491 | 7707 | 14857 | |
400-499K | 316 | 2609 | 5189 | |
500K+ | 156 | 1553 | 4749 | |
Total Working Age Population | 7,915 | 88,093 | 229,965 | |
In Work Force | 5,508 | 54,578 | 133,179 | |
Not In Work Force | 2,407 | 33,515 | 96,787 | |
Workforce Employed | 5,316 | 52,298 | 127,293 | |
Workforce Unemployed | 125 | 2,140 | 5,644 | |
Civlian Workforce | 5,441 | 54,438 | 132,936 | |
Military Workforce | 67 | 140 | 242 | |
Total Households | 4,034 | 41,810 | 108,373 | |
Family Households | 2,441 | 27,465 | 70,945 | |
Non-Family Households | 1,593 | 14,345 | 37,428 | |
Married Couple | 1,753 | 21,704 | 54,452 | |
Other Family | 688 | 5,761 | 16,493 | |
Married w/Child | 591 | 6,515 | 17,006 | |
Single Male w/Child | 161 | 1,003 | 2,470 | |
Single Female w/Child | 249 | 1,761 | 5,033 |
Population Change Last Two Decades - Plus Projection
2000 | % | 2010 | % | 2020 | % | 2030 | |
---|---|---|---|---|---|---|---|
Arizona | 5,130,632 | +25 | 6,392,017 | +14 | 7,286,100 | +14 | 8,284,900 |
Maricopa County | 3,072,149 | +24 | 3,817,117 | +16 | 4,436,900 | +15 | 5,107,700 |
Total Working Age Population:
Total Households:
Total Working Age Population:
Total Households:
Total Working Age Population:
Total Households: