Industrial Properties
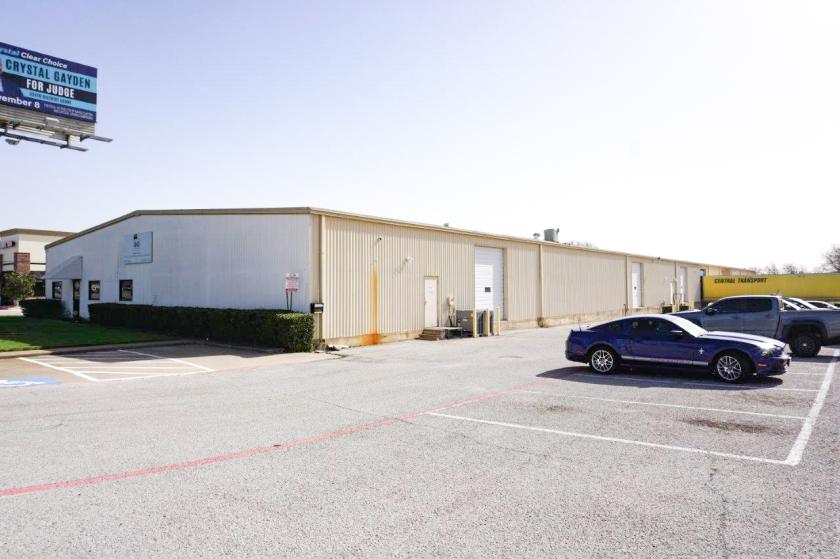
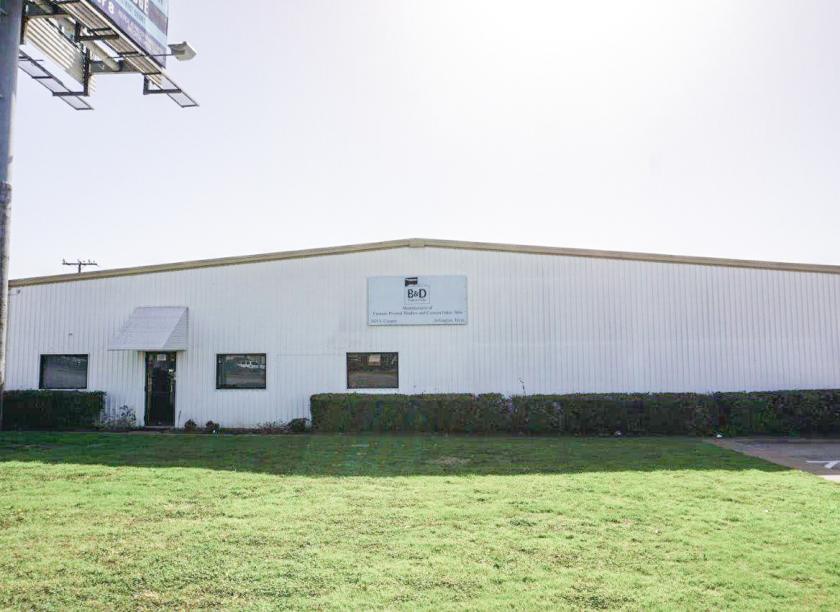
2621 South Cooper Street Arlington, TX 76015
2621 South Cooper Street Arlington, TX 76015
Details & Description
Property Highlights
• Two (2) Dock High Doors.
• Two (2) Dock High Doors.
Listing Agents

Troy Morgan
O: 214-466-1543
M: 817-714-8395
troy@structurecommercial.com
O: 214-466-1543
M: 817-714-8395
troy@structurecommercial.com
While we strive to provide the most accurate information, all listing information, and demographic data, is provided by third-parties. As such, MyEListing will not be responsible for the accuracy of the information. It is strongly recommended that you verify all information with the listing agent, and any relevant agencies, prior to making any decisions.