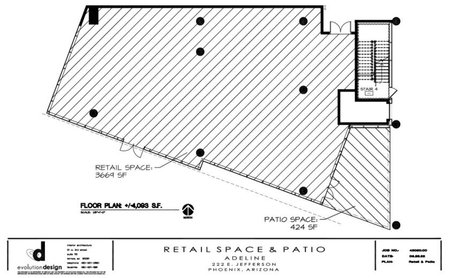
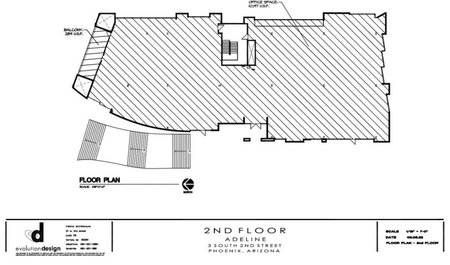
1-Mile | 3-Miles | 5-Miles | ||
---|---|---|---|---|
Total Population | 14,587 | 92,878 | 366,689 | |
Population Median Age | 34 | 35 | 34 | |
Population by Age | 0-9 Yrs | 972 (6%) | 11485 (12%) | 51140 (13%) |
10-19 Yrs | 2430 (16%) | 13439 (14%) | 54526 (14%) | |
20-29 Yrs | 4262 (29%) | 17460 (18%) | 66741 (18%) | |
30-39 Yrs | 2360 (16%) | 14781 (15%) | 56751 (15%) | |
40-49 Yrs | 1128 (7%) | 11834 (12%) | 48551 (13%) | |
50-59 Yrs | 1096 (7%) | 10598 (11%) | 40913 (11%) | |
60-69 Yrs | 1186 (8%) | 7773 (8%) | 28066 (7%) | |
70+ Yrs | 1153 (7%) | 5508 (5%) | 20002 (5%) | |
Median HH Income | $36,701 | $42,326 | $46,340 | |
Total Household Income | < 24K | 2660 (40%) | 11371 (31%) | 33530 (26%) |
25-49K | 1444 (21%) | 8668 (24%) | 35241 (27%) | |
50-74K | 763 (11%) | 5624 (15%) | 24071 (18%) | |
75-99K | 625 (9%) | 3765 (10%) | 13756 (10%) | |
100-199K | 890 (13%) | 4698 (13%) | 17272 (13%) | |
200K+ | 254 (3%) | 1500 (4%) | 4456 (3%) | |
Highest Education Level | No Diploma | 1839 | 16014 | 63182 |
Diploma or GED | 1673 | 13881 | 57225 | |
Some College | 1346 | 10673 | 46149 | |
Assoc. Degree | 436 | 3312 | 15021 | |
Bachelors Degree | 2453 | 10560 | 31396 | |
Higher Degree | 1269 | 5866 | 17888 | |
Total Housing Units | 7,983 | 41,217 | 142,920 | |
--Owner-Occupied | 1,259 | 12,558 | 51,244 | |
--Renter-Occupied | 5,377 | 23,068 | 77,082 | |
Owner-Occupied Values | < 100K | 181 | 1922 | 7860 |
100-199K | 196 | 2856 | 16060 | |
200-299K | 599 | 3502 | 14752 | |
300-399K | 121 | 2016 | 6434 | |
400-499K | 89 | 976 | 2613 | |
500K+ | 73 | 1287 | 3524 | |
Total Working Age Population | 13,108 | 74,012 | 283,479 | |
In Work Force | 8,794 | 48,588 | 187,693 | |
Not In Work Force | 4,314 | 25,425 | 95,786 | |
Workforce Employed | 8,417 | 46,122 | 176,611 | |
Workforce Unemployed | 372 | 2,447 | 10,854 | |
Civlian Workforce | 8,789 | 48,569 | 187,465 | |
Military Workforce | 4 | 19 | 229 | |
Total Households | 6,637 | 35,627 | 128,326 | |
Family Households | 1,684 | 16,815 | 71,536 | |
Non-Family Households | 4,953 | 18,812 | 56,790 | |
Married Couple | 888 | 9,115 | 39,802 | |
Other Family | 796 | 7,700 | 31,734 | |
Married w/Child | 235 | 4,023 | 19,260 | |
Single Male w/Child | 111 | 963 | 4,726 | |
Single Female w/Child | 329 | 3,432 | 13,338 |
Population Change Last Two Decades - Plus Projection
2000 | % | 2010 | % | 2020 | % | 2030 | |
---|---|---|---|---|---|---|---|
Arizona | 5,130,632 | +25 | 6,392,017 | +14 | 7,286,100 | +14 | 8,284,900 |
Maricopa County | 3,072,149 | +24 | 3,817,117 | +16 | 4,436,900 | +15 | 5,107,700 |
Total Working Age Population:
Total Households:
Total Working Age Population:
Total Households:
Total Working Age Population:
Total Households: