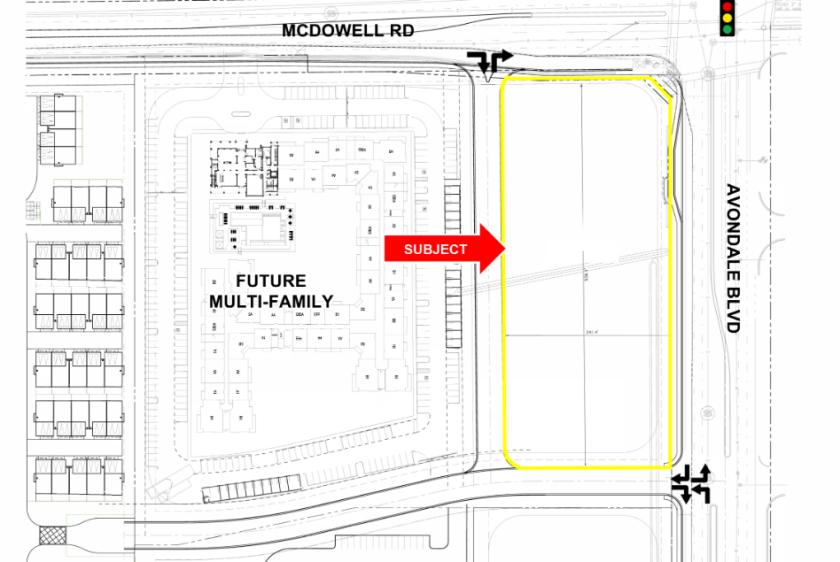
1-Mile | 3-Miles | 5-Miles | ||
---|---|---|---|---|
Total Population | 9,811 | 102,263 | 252,673 | |
Population Median Age | 33 | 34 | 33 | |
Population by Age | 0-9 Yrs | 1576 (16%) | 15800 (15%) | 39761 (15%) |
10-19 Yrs | 1688 (17%) | 15159 (14%) | 41041 (16%) | |
20-29 Yrs | 1478 (15%) | 17730 (17%) | 42032 (16%) | |
30-39 Yrs | 1502 (15%) | 14496 (14%) | 36126 (14%) | |
40-49 Yrs | 1121 (11%) | 12675 (12%) | 32714 (12%) | |
50-59 Yrs | 1205 (12%) | 12525 (12%) | 28940 (11%) | |
60-69 Yrs | 694 (7%) | 8718 (8%) | 19110 (7%) | |
70+ Yrs | 547 (5%) | 5160 (5%) | 12950 (5%) | |
Median HH Income | $73,462 | $71,776 | $69,000 | |
Total Household Income | < 24K | 288 (9%) | 3708 (11%) | 9142 (12%) |
25-49K | 688 (22%) | 6398 (20%) | 15765 (21%) | |
50-74K | 578 (18%) | 6296 (20%) | 16025 (21%) | |
75-99K | 673 (21%) | 5778 (18%) | 12564 (16%) | |
100-199K | 725 (23%) | 7941 (25%) | 18095 (24%) | |
200K+ | 112 (3%) | 1196 (3%) | 3176 (4%) | |
Highest Education Level | No Diploma | 870 | 10100 | 28231 |
Diploma or GED | 1530 | 17011 | 42160 | |
Some College | 1735 | 16667 | 37157 | |
Assoc. Degree | 403 | 6531 | 14441 | |
Bachelors Degree | 787 | 8448 | 19025 | |
Higher Degree | 668 | 4595 | 10620 | |
Total Housing Units | 3,195 | 33,446 | 79,485 | |
--Owner-Occupied | 1,693 | 18,616 | 46,368 | |
--Renter-Occupied | 1,372 | 12,702 | 28,398 | |
Owner-Occupied Values | < 100K | 78 | 1051 | 3254 |
100-199K | 304 | 4774 | 13861 | |
200-299K | 1067 | 9122 | 19432 | |
300-399K | 223 | 3033 | 6193 | |
400-499K | 9 | 394 | 2078 | |
500K+ | 12 | 240 | 1550 | |
Total Working Age Population | 7,071 | 77,088 | 187,569 | |
In Work Force | 5,381 | 54,367 | 130,718 | |
Not In Work Force | 1,690 | 22,721 | 56,851 | |
Workforce Employed | 5,005 | 51,079 | 122,439 | |
Workforce Unemployed | 319 | 2,768 | 7,327 | |
Civlian Workforce | 5,324 | 53,847 | 129,766 | |
Military Workforce | 57 | 519 | 953 | |
Total Households | 3,065 | 31,317 | 74,766 | |
Family Households | 2,271 | 23,774 | 57,356 | |
Non-Family Households | 793 | 7,543 | 17,411 | |
Married Couple | 1,503 | 15,629 | 38,168 | |
Other Family | 768 | 8,145 | 19,188 | |
Married w/Child | 590 | 7,368 | 19,411 | |
Single Male w/Child | 142 | 1,374 | 3,000 | |
Single Female w/Child | 267 | 2,981 | 7,656 |
Population Change Last Two Decades - Plus Projection
2000 | % | 2010 | % | 2020 | % | 2030 | |
---|---|---|---|---|---|---|---|
Arizona | 5,130,632 | +25 | 6,392,017 | +14 | 7,286,100 | +14 | 8,284,900 |
Maricopa County | 3,072,149 | +24 | 3,817,117 | +16 | 4,436,900 | +15 | 5,107,700 |
Total Working Age Population:
Total Households:
Total Working Age Population:
Total Households:
Total Working Age Population:
Total Households: