Retail Space
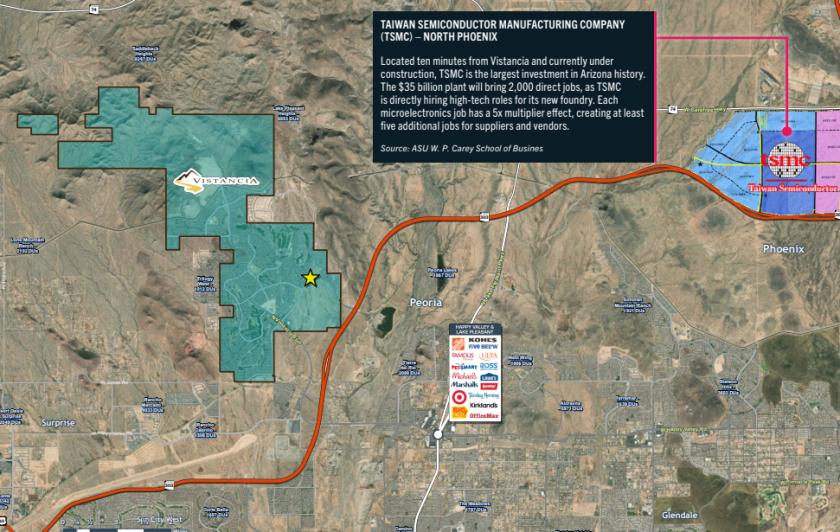
El Mirage Road and Lone Mountain Pkwy Peoria, AZ 85383
El Mirage Road and Lone Mountain Pkwy Peoria, AZ 85383
Details & Description
Property Highlights
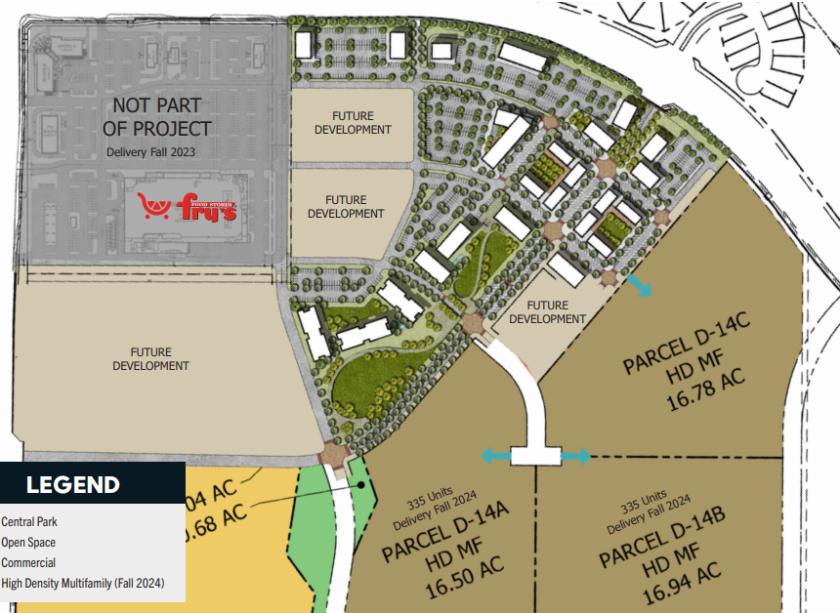
- • Retail Delivery: 2024
- • Fry’s Delivery: Fall 2023
- • Multifamily Delivery: Fall 2024
Listing Agents

Charles Skaggs
O: 602-368-1737
cskaggs@w-retail.com
O: 602-368-1737
cskaggs@w-retail.com

Jake McClaughry
O: 602-368-1088
jmcclaughry@w-retail.com
O: 602-368-1088
jmcclaughry@w-retail.com
While we strive to provide the most accurate information, all listing information, and demographic data, is provided by third-parties. As such, MyEListing will not be responsible for the accuracy of the information. It is strongly recommended that you verify all information with the listing agent, and any relevant agencies, prior to making any decisions.