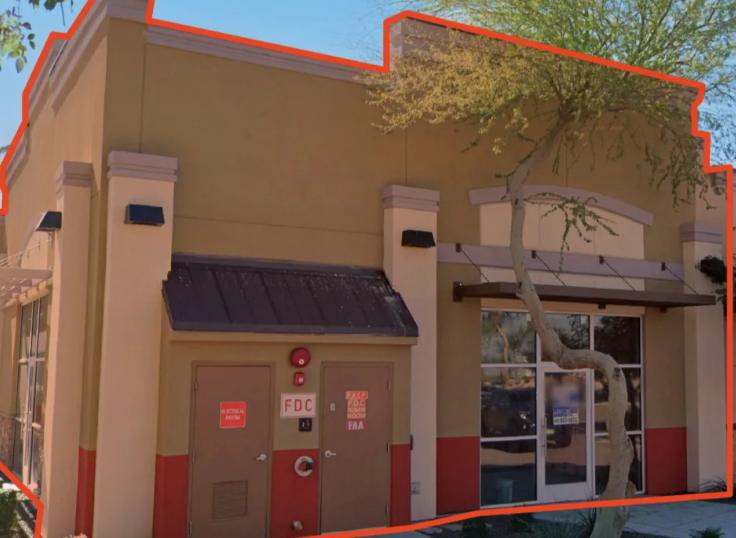
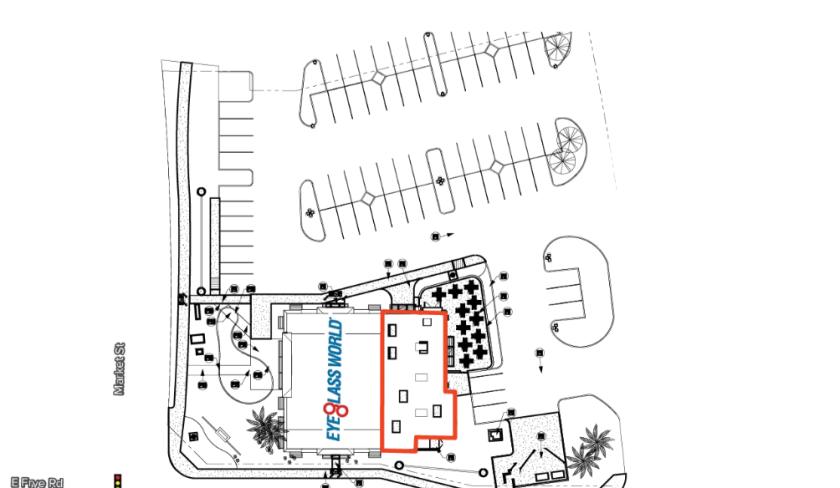
Retail Space
2649 South Market Street Gilbert, AZ 85295
2649 South Market Street Gilbert, AZ 85295
Details & Description
Property Highlights
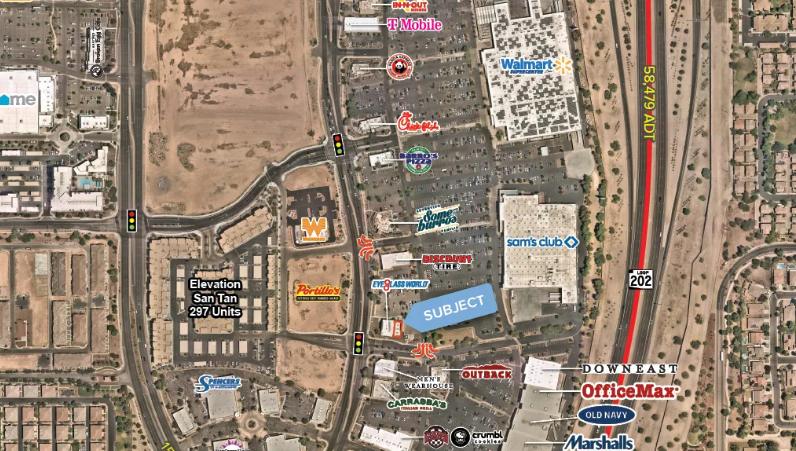
• Whataburger newly operating and Portillo's coming soon directly west
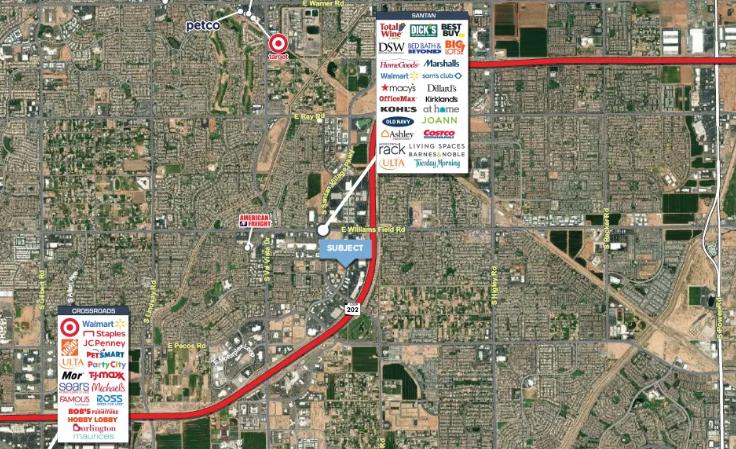
• Along Loop 202 which is home to traffic counts of ±58,500 VPD
Additional Photos
Listing Agents

Justin DiBiase
O: 480-653-9212
jdibiase@w-retail.com
O: 480-653-9212
jdibiase@w-retail.com

Neil Board
O: 602-778-3781
nboard@w-retail.com
O: 602-778-3781
nboard@w-retail.com
While we strive to provide the most accurate information, all listing information, and demographic data, is provided by third-parties. As such, MyEListing will not be responsible for the accuracy of the information. It is strongly recommended that you verify all information with the listing agent, and any relevant agencies, prior to making any decisions.


