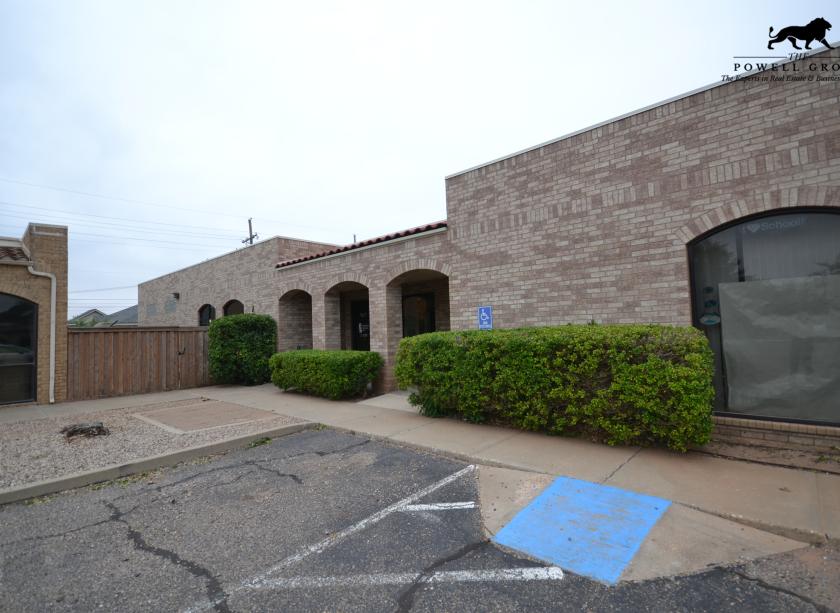
Office Space
4601 66th Street Lubbock, TX 79414
4601 66th Street Lubbock, TX 79414
Details & Description
Property Highlights
• Easy access to South Loop 289 & Quaker Avenue
• Ample Parking
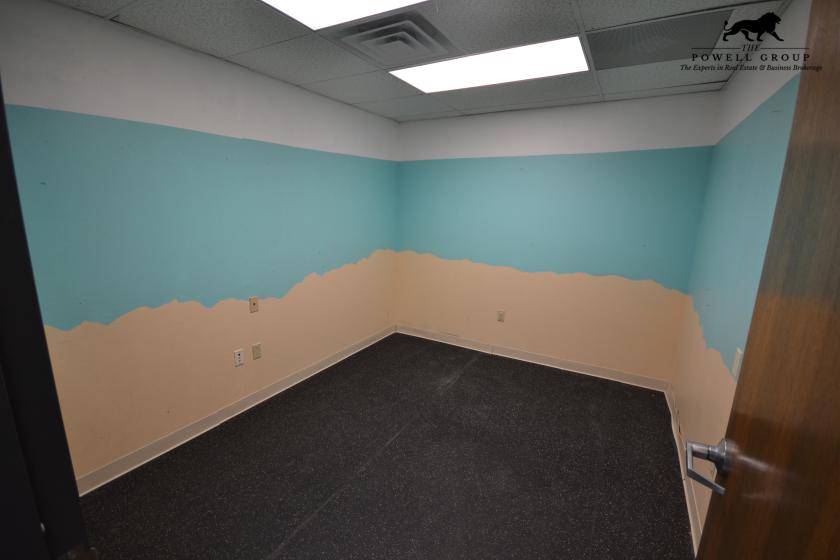
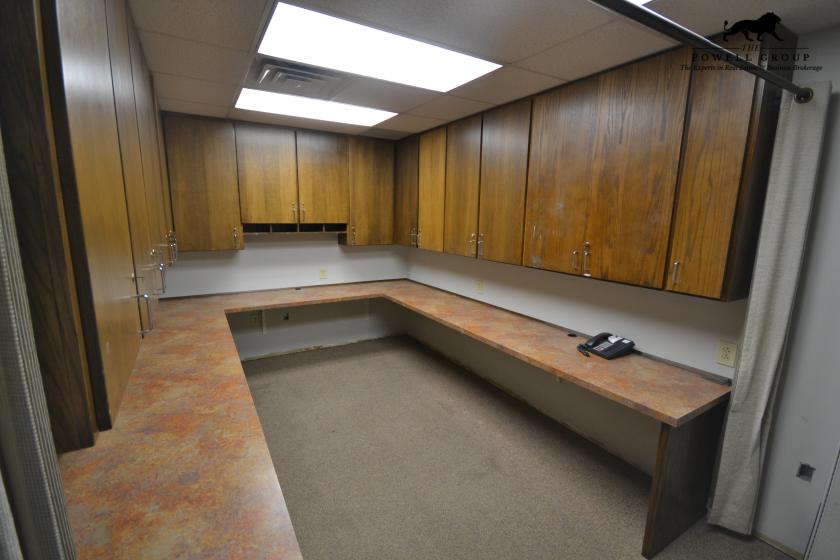
Additional Photos


Listing Agents

David Powell
O: 806-239-0804
M: 806-239-0804
lubbockcommercial@gmail.com
O: 806-239-0804
M: 806-239-0804
lubbockcommercial@gmail.com
While we strive to provide the most accurate information, all listing information, and demographic data, is provided by third-parties. As such, MyEListing will not be responsible for the accuracy of the information. It is strongly recommended that you verify all information with the listing agent, and any relevant agencies, prior to making any decisions.