Commercial Land
1829 South 17th Street Sheboygan, WI 53081
1829 South 17th Street Sheboygan, WI 53081

Details & Description
Property Highlights
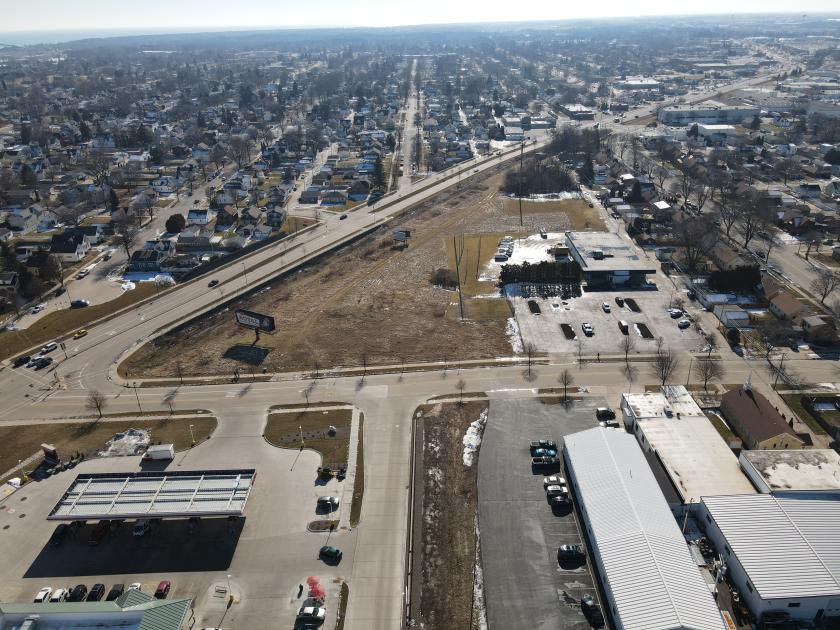
• Planned bike trail will run along edge of property on former railroad right-of-way
• Located on traffic controlled intersection of S. Business Drive/Hwy. 28
Additional Photos


Listing Agents

Dane Checolinski
O: 920-783-6330
M: 920-344-8732
danec@naipfefferle.com
O: 920-783-6330
M: 920-344-8732
danec@naipfefferle.com
While we strive to provide the most accurate information, all listing information, and demographic data, is provided by third-parties. As such, MyEListing will not be responsible for the accuracy of the information. It is strongly recommended that you verify all information with the listing agent, and any relevant agencies, prior to making any decisions.