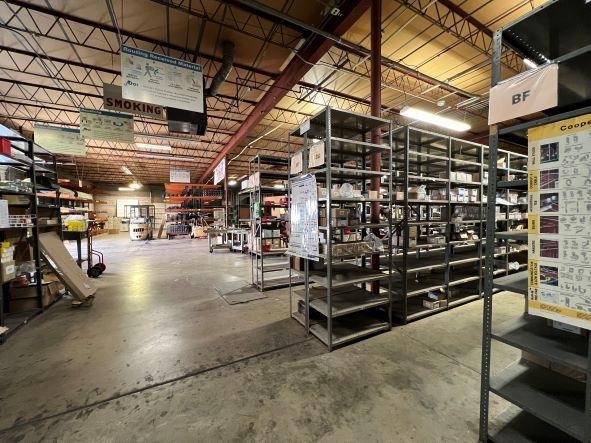
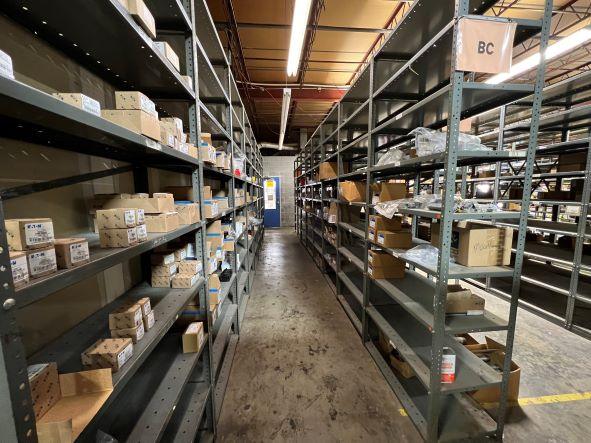
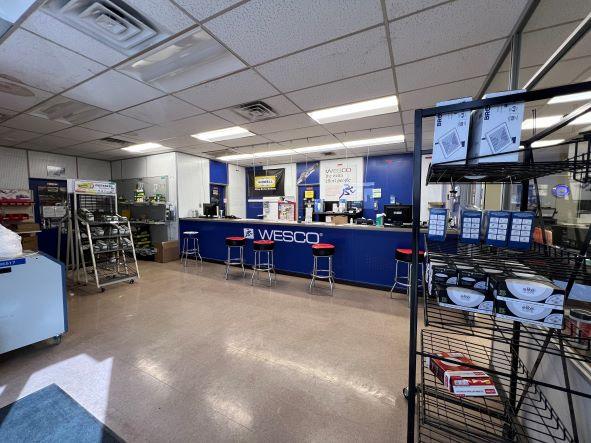
Flex-Office-Warehouse
520 34th Street Lubbock, TX 79404
520 34th Street Lubbock, TX 79404

Details & Description
Property Highlights
• Great location, just east of I-27
• Great location, just east of I-27
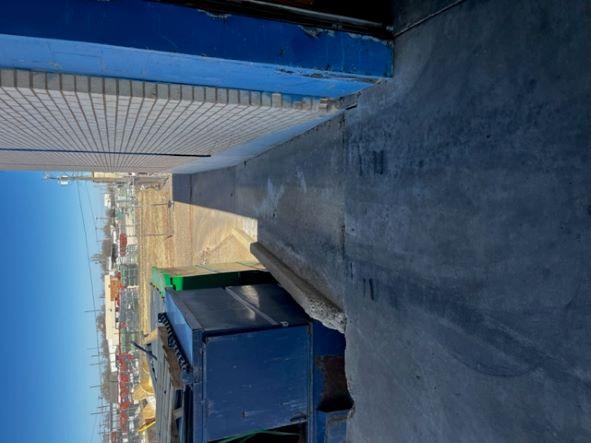
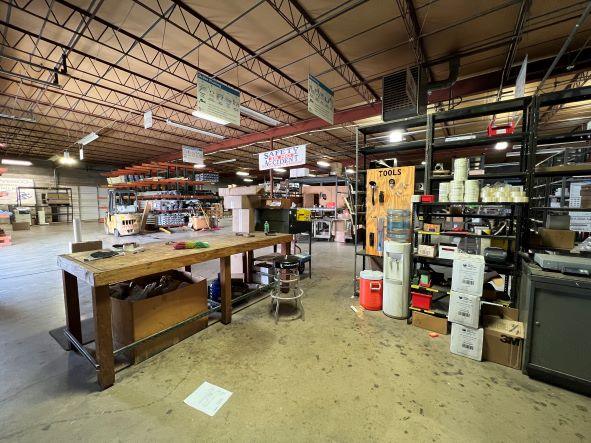
Additional Photos


Listing Agents

Jack Chapman
O: 806-789-8257
jack@lubbockwestar.com
O: 806-789-8257
jack@lubbockwestar.com
While we strive to provide the most accurate information, all listing information, and demographic data, is provided by third-parties. As such, MyEListing will not be responsible for the accuracy of the information. It is strongly recommended that you verify all information with the listing agent, and any relevant agencies, prior to making any decisions.