Retail Space
200 East Abram Street Arlington, TX 76010
200 East Abram Street Arlington, TX 76010

Details & Description
Property Highlights
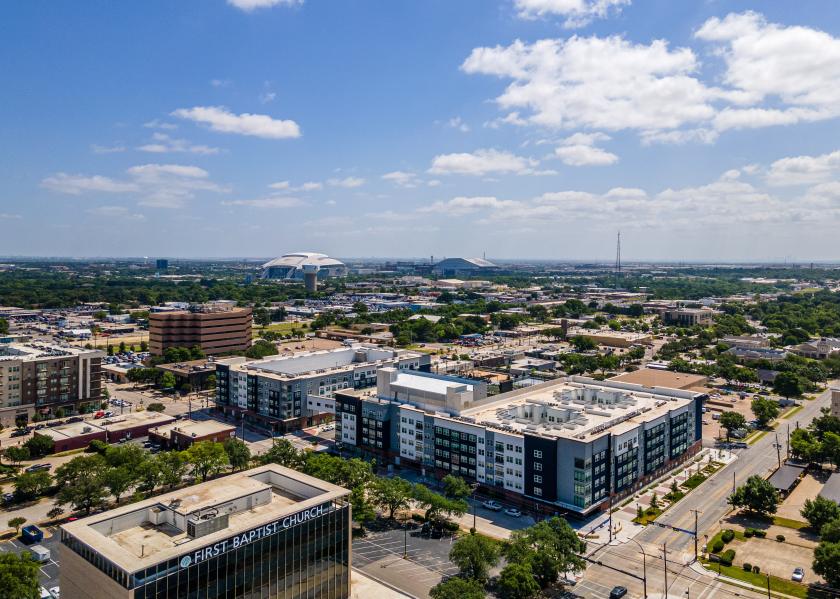
• Prime downtown Arlington retail location at the SE corner of East Abram & South Mesquite with over 300 apartment uni
• Optimal free parking with adjacent garage attached.
Additional Photos


Listing Agents

Troy Morgan
O: 214-466-1543
M: 817-714-8395
troy@structurecommercial.com
O: 214-466-1543
M: 817-714-8395
troy@structurecommercial.com
While we strive to provide the most accurate information, all listing information, and demographic data, is provided by third-parties. As such, MyEListing will not be responsible for the accuracy of the information. It is strongly recommended that you verify all information with the listing agent, and any relevant agencies, prior to making any decisions.


