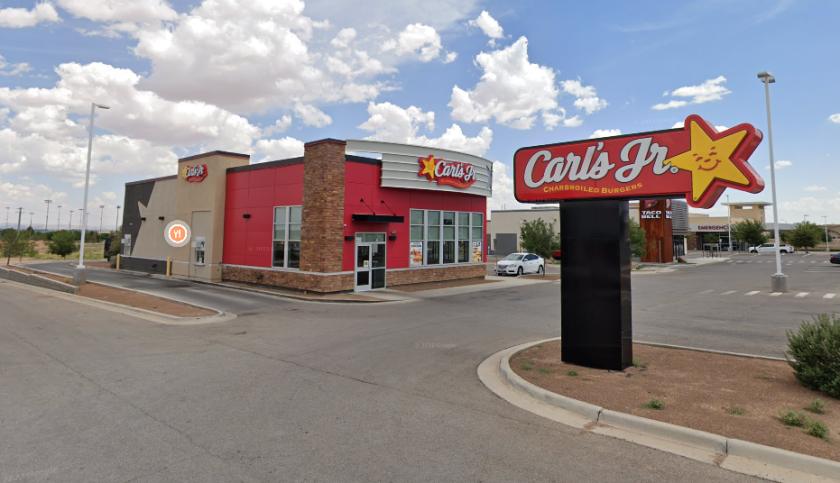
1-Mile | 3-Miles | 5-Miles | ||
---|---|---|---|---|
Total Population | 18,398 | 112,702 | 295,519 | |
Population Median Age | 35 | 35 | 35 | |
Population by Age | 0-9 Yrs | 2480 (13%) | 13832 (12%) | 41992 (14%) |
10-19 Yrs | 2687 (14%) | 19092 (16%) | 47520 (16%) | |
20-29 Yrs | 3414 (18%) | 19905 (17%) | 47599 (16%) | |
30-39 Yrs | 2336 (12%) | 13721 (12%) | 38467 (13%) | |
40-49 Yrs | 1973 (10%) | 13788 (12%) | 36337 (12%) | |
50-59 Yrs | 2858 (15%) | 13786 (12%) | 33530 (11%) | |
60-69 Yrs | 1678 (9%) | 10351 (9%) | 26911 (9%) | |
70+ Yrs | 972 (5%) | 8226 (7%) | 23162 (7%) | |
Median HH Income | $58,715 | $54,778 | $51,903 | |
Total Household Income | < 24K | 834 (15%) | 7769 (21%) | 21491 (22%) |
25-49K | 1254 (22%) | 8438 (23%) | 23684 (25%) | |
50-74K | 1354 (24%) | 7592 (21%) | 18911 (20%) | |
75-99K | 1156 (20%) | 4865 (13%) | 11876 (12%) | |
100-199K | 849 (15%) | 6488 (18%) | 15799 (16%) | |
200K+ | 72 (1%) | 875 (2%) | 2058 (2%) | |
Highest Education Level | No Diploma | 1721 | 10872 | 34551 |
Diploma or GED | 3346 | 17753 | 45631 | |
Some College | 2749 | 17597 | 44864 | |
Assoc. Degree | 1252 | 6547 | 17117 | |
Bachelors Degree | 2499 | 12227 | 28142 | |
Higher Degree | 316 | 4652 | 11046 | |
Total Housing Units | 5,715 | 38,017 | 99,722 | |
--Owner-Occupied | 3,774 | 22,721 | 62,663 | |
--Renter-Occupied | 1,745 | 13,306 | 31,156 | |
Owner-Occupied Values | < 100K | 627 | 4567 | 17421 |
100-199K | 2776 | 14043 | 36096 | |
200-299K | 271 | 3048 | 6975 | |
300-399K | 52 | 684 | 1390 | |
400-499K | 13 | 105 | 223 | |
500K+ | 35 | 273 | 557 | |
Total Working Age Population | 14,197 | 87,339 | 223,975 | |
In Work Force | 9,297 | 56,186 | 141,690 | |
Not In Work Force | 4,900 | 31,153 | 82,284 | |
Workforce Employed | 8,663 | 51,713 | 130,303 | |
Workforce Unemployed | 606 | 3,559 | 8,485 | |
Civlian Workforce | 9,268 | 55,272 | 138,789 | |
Military Workforce | 28 | 914 | 2,902 | |
Total Households | 5,519 | 36,027 | 93,819 | |
Family Households | 4,286 | 26,486 | 70,975 | |
Non-Family Households | 1,233 | 9,541 | 22,844 | |
Married Couple | 2,469 | 16,536 | 45,344 | |
Other Family | 1,817 | 9,950 | 25,631 | |
Married w/Child | 1,027 | 7,378 | 20,477 | |
Single Male w/Child | 79 | 835 | 2,526 | |
Single Female w/Child | 702 | 4,103 | 10,170 |
Population Change Last Two Decades - Plus Projection
2000 | % | 2010 | % | 2020 | % | 2030 | |
---|---|---|---|---|---|---|---|
Texas | 20,851,820 | +21 | 25,145,561 | +18 | 29,677,668 | +18 | 34,894,452 |
El Paso County | 679,622 | +18 | 800,647 | +9 | 876,120 | +7 | 936,697 |
Total Working Age Population:
Total Households:
Total Working Age Population:
Total Households:
Total Working Age Population:
Total Households: