Retail Space
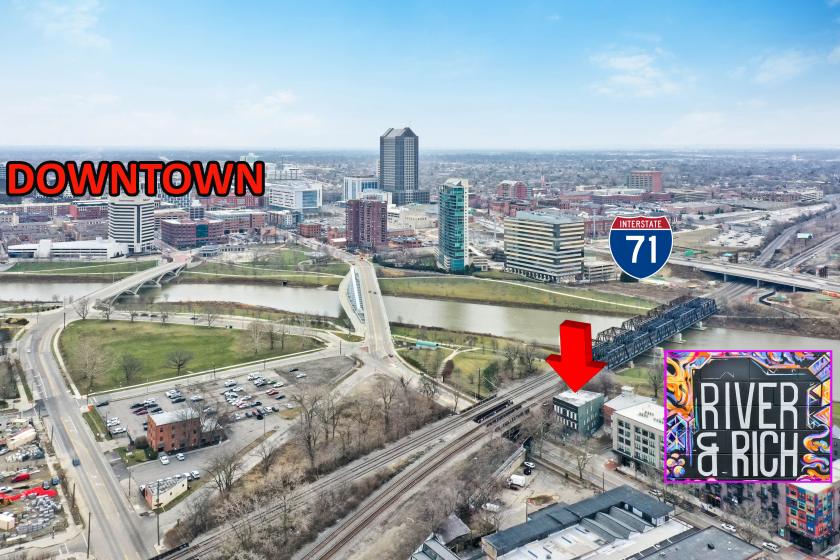
373-375 West Rich Street Columbus, OH 43215
373-375 West Rich Street Columbus, OH 43215

Details & Description
Property Highlights
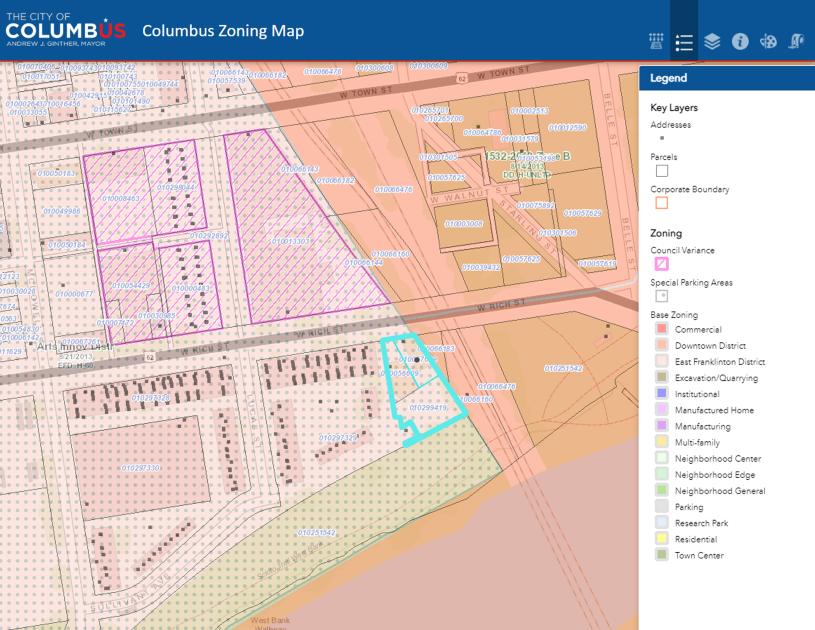
- • REDEVELOPMENT OPPORTUNITY
- • GREAT LOCATED IN FRANKLINTON DOWNTOWN
- • OPPORTUNITY ZONE
Additional Photos


Listing Agents

Alex Marsh
O: 614-245-2182
M: 614-937-3658
amarsh@rweiler.com
O: 614-245-2182
M: 614-937-3658
amarsh@rweiler.com
While we strive to provide the most accurate information, all listing information, and demographic data, is provided by third-parties. As such, MyEListing will not be responsible for the accuracy of the information. It is strongly recommended that you verify all information with the listing agent, and any relevant agencies, prior to making any decisions.