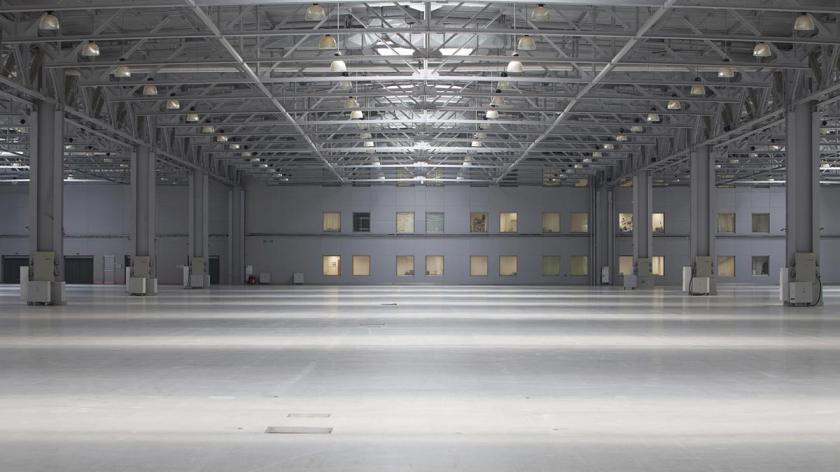
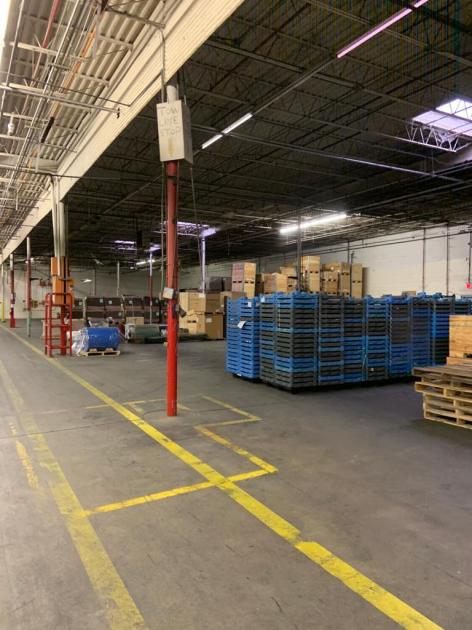
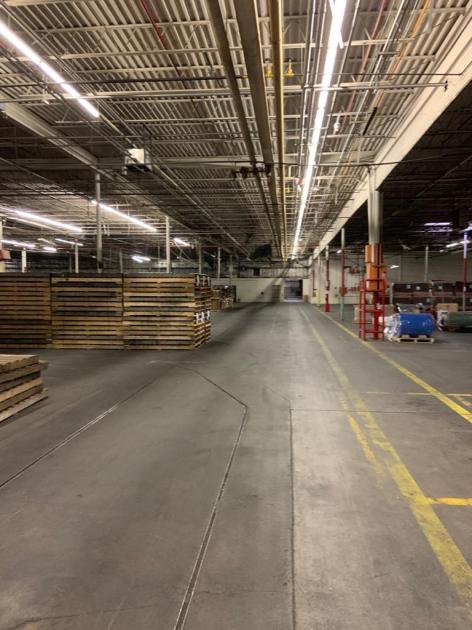
Built out logistics facility
The building is 34,500 amp with 3 phase electric.
14 buildings
Building 1: 162,00 SF
Building 2: 47,700 SF
Building 3: 50,350 SF
Building 4: 57,500 SF
Building 5: 75,600 SF
Building 6: 116,100 SF
Building 7: 4,400 SF
Building 8: 21,500 SF
Building 9: 30,000 SF
Building 10: 13,000 SF
Building 11: 83,700 SF
Building 12: 60,000 SF
Building 13: 81,000 SF
Building 14: 40,500 SF
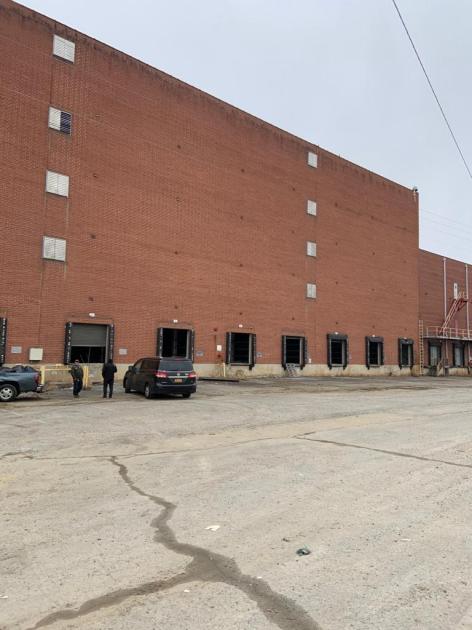
Construction
Floors: Reinforced concrete
Walls: Brick on block and insulated metal
Roof: Rubber membrane over insulated metal deck and insulated standing seam metals.
Columns: Steel
Dimensions
Section twelve: 200'x 300'
Section thirteen: 300'x 270"
Section fourteen: 270'x 150'
Column Spacing
Section twelve: 30'x 50'
Sections thirteen/fourteen: 30'x 30'
Ceiling Height
Section twelve: 19' clear below the steel at the eaves and 20' below the steel at the center
Sections thirteen/fourteen: 18'
Truck Loading
Section twelve: One 10' x 10' manual rollup dock high door with edge of dock levelers and three 8'x 9' manual rollup doors with edge of dock levelers and seals. One 14'x 14' electric drive-in door
Section thirteen: Four 8'x 9' manual rollup doors with levelers.
Section fourteen: Four 8'x 9' manual rollup doors, three with levelers.
Two more doors access an exterior concrete platform
Parking
Ample parking on north and southsides of the building
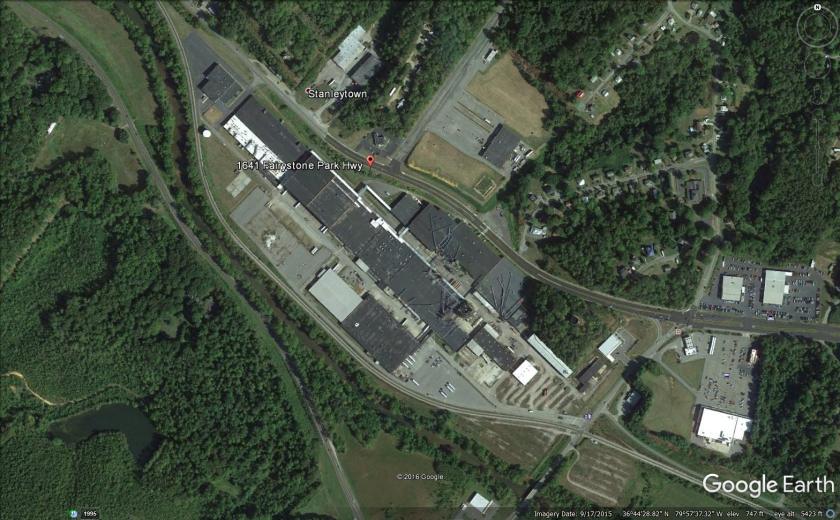
Located in Stanleytown, VA with easy access to US Route 220 & State Route 57.
Located approximately 1.5 miles west of four-lane US Hwy 220 providing access approx. 50 miles north of I-81 and Roanoke commercial airport
15.9 Miles from Blue Ridge Regional Airport
14.3 Miles from Martinsville Speedway
13.5+/- miles from Virginia/North Carolina state line
Nearby tenants include Food Lion, Hardee's, Dollar General, Family Dollar, CVS, Marathon Gas, and Western Union.