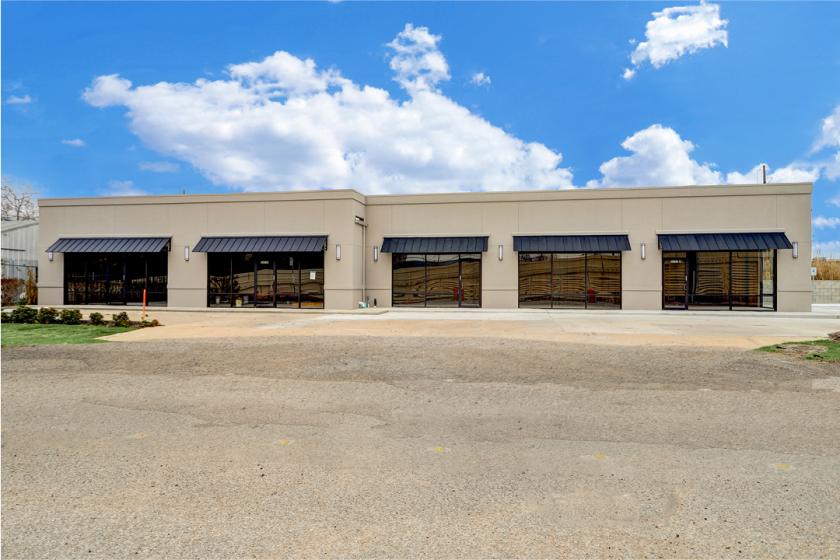
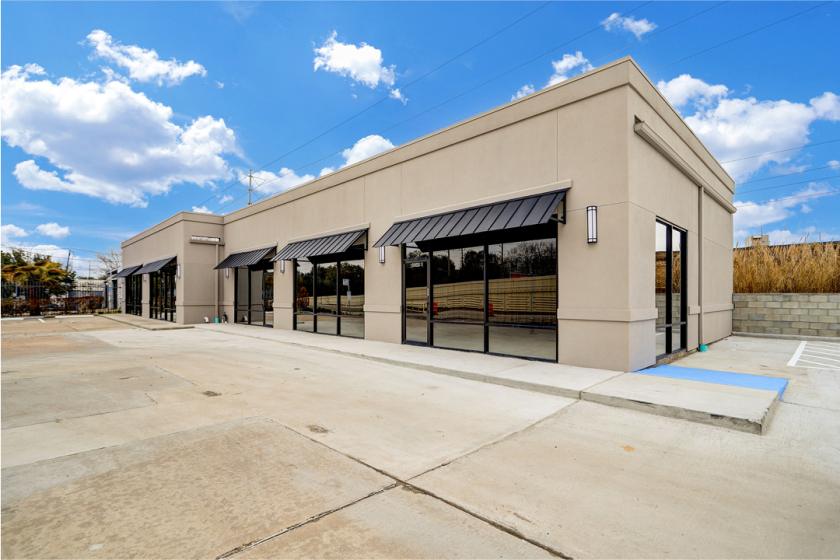
1-Mile | 3-Miles | 5-Miles | ||
---|---|---|---|---|
Total Population | 13,824 | 122,890 | 370,220 | |
Population Median Age | 35 | 36 | 37 | |
Population by Age | 0-9 Yrs | 756 (5%) | 15415 (12%) | 43465 (11%) |
10-19 Yrs | 935 (6%) | 13036 (10%) | 43197 (11%) | |
20-29 Yrs | 4849 (35%) | 27564 (22%) | 71794 (19%) | |
30-39 Yrs | 3006 (21%) | 19984 (16%) | 60823 (16%) | |
40-49 Yrs | 1579 (11%) | 14373 (11%) | 44599 (12%) | |
50-59 Yrs | 1076 (7%) | 12314 (10%) | 40794 (11%) | |
60-69 Yrs | 884 (6%) | 10114 (8%) | 34974 (9%) | |
70+ Yrs | 740 (5%) | 10089 (8%) | 30574 (8%) | |
Median HH Income | $51,744 | $53,672 | $66,617 | |
Total Household Income | < 24K | 1740 (22%) | 13994 (25%) | 30145 (19%) |
25-49K | 1864 (24%) | 11352 (20%) | 28426 (18%) | |
50-74K | 1982 (25%) | 10220 (18%) | 26703 (17%) | |
75-99K | 877 (11%) | 5033 (9%) | 16482 (10%) | |
100-199K | 1059 (13%) | 8257 (15%) | 29808 (19%) | |
200K+ | 118 (1%) | 5498 (10%) | 22782 (14%) | |
Highest Education Level | No Diploma | 308 | 7266 | 24217 |
Diploma or GED | 1205 | 13670 | 40494 | |
Some College | 1529 | 11278 | 38950 | |
Assoc. Degree | 859 | 4775 | 11925 | |
Bachelors Degree | 2908 | 19705 | 64745 | |
Higher Degree | 3794 | 24860 | 69426 | |
Total Housing Units | 9,114 | 63,059 | 176,082 | |
--Owner-Occupied | 1,265 | 18,374 | 69,579 | |
--Renter-Occupied | 6,373 | 35,981 | 84,766 | |
Owner-Occupied Values | < 100K | 395 | 4363 | 15602 |
100-199K | 727 | 3895 | 12575 | |
200-299K | 122 | 2164 | 7765 | |
300-399K | 5 | 1492 | 6597 | |
400-499K | 9 | 1371 | 4593 | |
500K+ | 7 | 5091 | 22446 | |
Total Working Age Population | 12,651 | 99,816 | 301,501 | |
In Work Force | 8,478 | 62,353 | 196,071 | |
Not In Work Force | 4,173 | 37,463 | 105,430 | |
Workforce Employed | 8,209 | 57,594 | 182,060 | |
Workforce Unemployed | 269 | 4,742 | 13,899 | |
Civlian Workforce | 8,478 | 62,337 | 195,959 | |
Military Workforce | 0 | 17 | 112 | |
Total Households | 7,638 | 54,355 | 154,345 | |
Family Households | 2,350 | 24,904 | 79,768 | |
Non-Family Households | 5,288 | 29,451 | 74,577 | |
Married Couple | 1,519 | 15,268 | 53,002 | |
Other Family | 831 | 9,635 | 26,766 | |
Married w/Child | 504 | 6,687 | 22,056 | |
Single Male w/Child | 21 | 778 | 2,365 | |
Single Female w/Child | 246 | 3,503 | 8,754 |
Population Change Last Two Decades - Plus Projection
2000 | % | 2010 | % | 2020 | % | 2030 | |
---|---|---|---|---|---|---|---|
Texas | 20,851,820 | +21 | 25,145,561 | +18 | 29,677,668 | +18 | 34,894,452 |
Harris County | 3,400,578 | +20 | 4,092,459 | +22 | 4,978,845 | +19 | 5,924,750 |
Total Working Age Population:
Total Households:
Total Working Age Population:
Total Households:
Total Working Age Population:
Total Households: