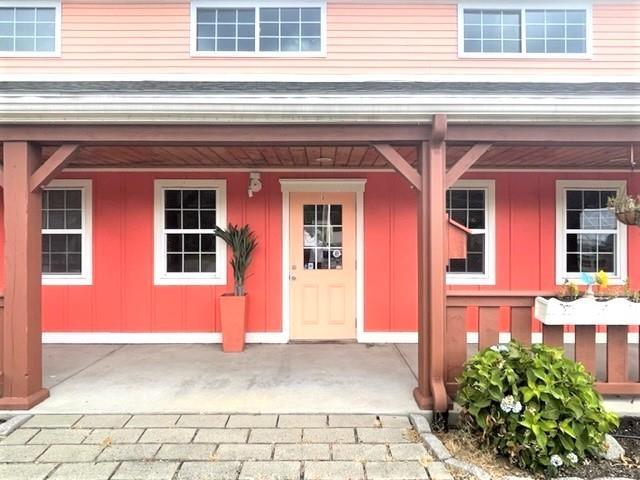
Flex-Office-Warehouse
14 Powwow River Road East Kingston, NH 03827
14 Powwow River Road East Kingston, NH 03827

Details & Description
Property Highlights
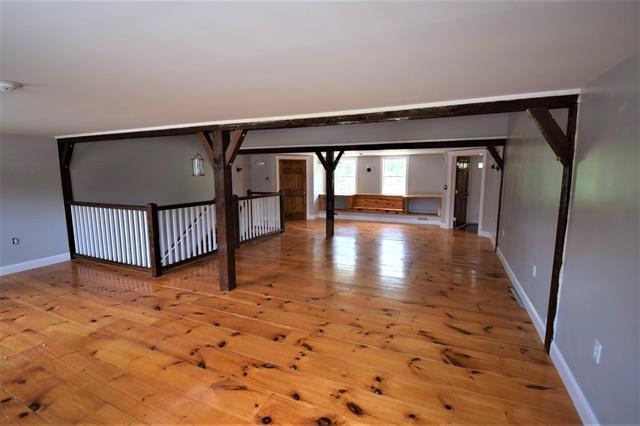
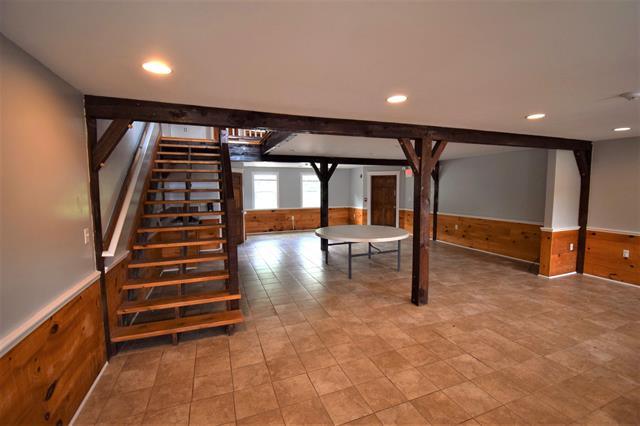
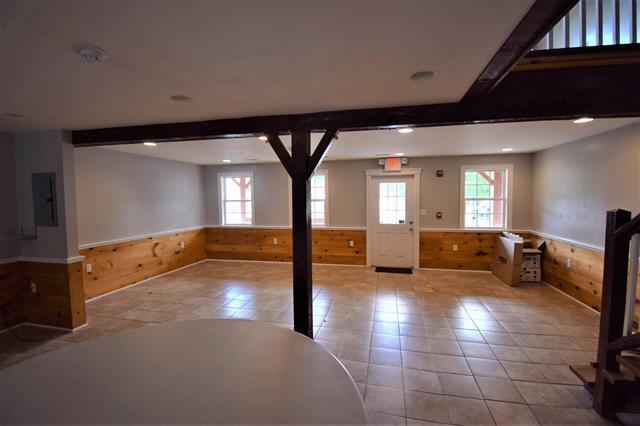
- • Multi-Level
- • Open Concept
- • Flex Use
- • In Unit Bathroom
- • In Unit Kitchenette
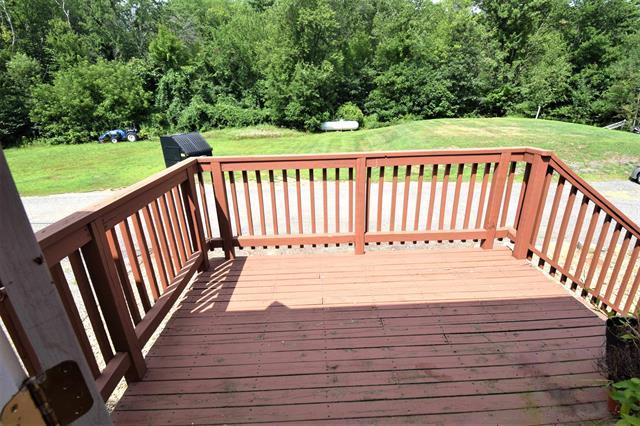
- • Ample Parking
Additional Photos

Listing Agents

Laurie Richards
O: 603-434-2377
M: 978-807-8456
laurietmr@gmail.com
O: 603-434-2377
M: 978-807-8456
laurietmr@gmail.com
While we strive to provide the most accurate information, all listing information, and demographic data, is provided by third-parties. As such, MyEListing will not be responsible for the accuracy of the information. It is strongly recommended that you verify all information with the listing agent, and any relevant agencies, prior to making any decisions.