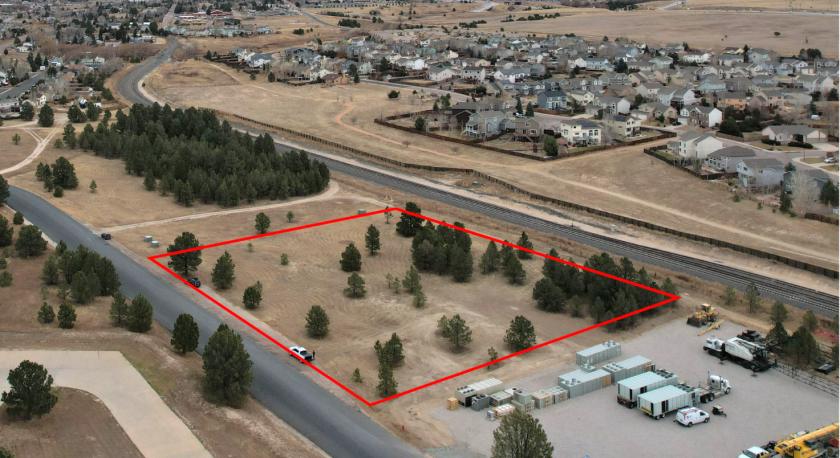
1-Mile | 3-Miles | 5-Miles | ||
---|---|---|---|---|
Total Population | 2,103 | 19,382 | 40,558 | |
Population Median Age | 40 | 40 | 39 | |
Population by Age | 0-9 Yrs | 291 (13%) | 2204 (11%) | 4315 (10%) |
10-19 Yrs | 267 (12%) | 2853 (14%) | 6410 (15%) | |
20-29 Yrs | 164 (7%) | 1575 (8%) | 4877 (12%) | |
30-39 Yrs | 328 (15%) | 2433 (12%) | 3975 (9%) | |
40-49 Yrs | 261 (12%) | 2575 (13%) | 5252 (12%) | |
50-59 Yrs | 291 (13%) | 2997 (15%) | 6749 (16%) | |
60-69 Yrs | 278 (13%) | 2937 (15%) | 5393 (13%) | |
70+ Yrs | 223 (10%) | 1808 (9%) | 3586 (8%) | |
Median HH Income | $83,888 | $116,220 | $124,545 | |
Total Household Income | < 24K | 114 (14%) | 695 (9%) | 1049 (7%) |
25-49K | 91 (11%) | 600 (8%) | 1111 (8%) | |
50-74K | 137 (17%) | 790 (11%) | 1339 (9%) | |
75-99K | 139 (17%) | 795 (11%) | 1441 (10%) | |
100-199K | 220 (28%) | 2714 (38%) | 5701 (42%) | |
200K+ | 82 (10%) | 1372 (19%) | 2801 (20%) | |
Highest Education Level | No Diploma | 67 | 345 | 735 |
Diploma or GED | 215 | 1582 | 2922 | |
Some College | 260 | 2670 | 5118 | |
Assoc. Degree | 185 | 1146 | 2225 | |
Bachelors Degree | 385 | 4320 | 8297 | |
Higher Degree | 335 | 3463 | 7107 | |
Total Housing Units | 797 | 7,160 | 14,051 | |
--Owner-Occupied | 640 | 6,091 | 11,921 | |
--Renter-Occupied | 144 | 875 | 1,522 | |
Owner-Occupied Values | < 100K | 35 | 202 | 295 |
100-199K | 33 | 119 | 163 | |
200-299K | 135 | 653 | 1101 | |
300-399K | 161 | 1066 | 2350 | |
400-499K | 130 | 1639 | 3199 | |
500K+ | 146 | 2412 | 4813 | |
Total Working Age Population | 1,637 | 15,425 | 32,803 | |
In Work Force | 1,083 | 9,984 | 22,201 | |
Not In Work Force | 554 | 5,441 | 10,602 | |
Workforce Employed | 1,017 | 9,439 | 18,744 | |
Workforce Unemployed | 53 | 422 | 856 | |
Civlian Workforce | 1,069 | 9,861 | 19,600 | |
Military Workforce | 13 | 123 | 2,601 | |
Total Households | 784 | 6,967 | 13,442 | |
Family Households | 556 | 5,544 | 11,076 | |
Non-Family Households | 228 | 1,423 | 2,366 | |
Married Couple | 518 | 5,249 | 10,302 | |
Other Family | 37 | 295 | 774 | |
Married w/Child | 199 | 1,863 | 3,864 | |
Single Male w/Child | 3 | 16 | 73 | |
Single Female w/Child | 23 | 160 | 301 |
Population Change Last Two Decades - Plus Projection
2000 | % | 2010 | % | 2020 | % | 2030 | |
---|---|---|---|---|---|---|---|
Colorado | 4,301,261 | +17 | 5,029,196 | +16 | 5,838,181 | +15 | 6,733,658 |
El Paso County | 516,929 | +20 | 622,263 | +18 | 735,176 | +16 | 855,206 |
Douglas County | 175,766 | +62 | 285,465 | +23 | 350,161 | +16 | 405,087 |
Total Working Age Population:
Total Households:
Total Working Age Population:
Total Households:
Total Working Age Population:
Total Households: