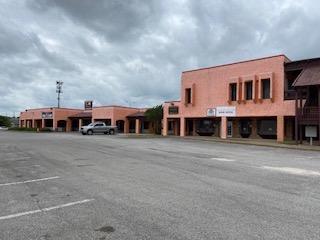
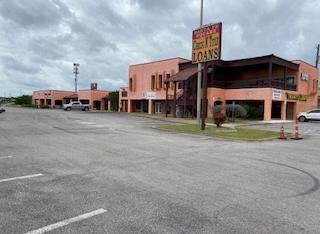
1-Mile | 3-Miles | 5-Miles | ||
---|---|---|---|---|
Total Population | 16,737 | 91,759 | 259,062 | |
Population Median Age | 30 | 36 | 36 | |
Population by Age | 0-9 Yrs | 3659 (21%) | 14688 (16%) | 39675 (15%) |
10-19 Yrs | 2251 (13%) | 13450 (14%) | 40820 (15%) | |
20-29 Yrs | 3308 (19%) | 12030 (13%) | 35949 (13%) | |
30-39 Yrs | 2636 (15%) | 13142 (14%) | 34507 (13%) | |
40-49 Yrs | 1457 (8%) | 9729 (10%) | 30477 (11%) | |
50-59 Yrs | 1735 (10%) | 10818 (11%) | 30344 (11%) | |
60-69 Yrs | 1077 (6%) | 9243 (10%) | 25292 (9%) | |
70+ Yrs | 614 (3%) | 8659 (9%) | 21999 (8%) | |
Median HH Income | $32,348 | $43,548 | $48,333 | |
Total Household Income | < 24K | 2941 (40%) | 9072 (27%) | 20507 (23%) |
25-49K | 2720 (37%) | 9953 (29%) | 24306 (27%) | |
50-74K | 924 (12%) | 5827 (17%) | 16855 (19%) | |
75-99K | 352 (4%) | 3776 (11%) | 9818 (11%) | |
100-199K | 331 (4%) | 4232 (12%) | 13359 (15%) | |
200K+ | 49 (0%) | 650 (1%) | 2104 (2%) | |
Highest Education Level | No Diploma | 1462 | 10684 | 36727 |
Diploma or GED | 3356 | 17822 | 46471 | |
Some College | 3170 | 15182 | 38178 | |
Assoc. Degree | 530 | 3516 | 8882 | |
Bachelors Degree | 652 | 6462 | 19326 | |
Higher Degree | 271 | 4240 | 10760 | |
Total Housing Units | 8,128 | 36,119 | 92,685 | |
--Owner-Occupied | 816 | 15,320 | 46,623 | |
--Renter-Occupied | 6,501 | 18,190 | 40,325 | |
Owner-Occupied Values | < 100K | 137 | 2677 | 10458 |
100-199K | 559 | 9195 | 23205 | |
200-299K | 84 | 2444 | 9183 | |
300-399K | 0 | 423 | 2326 | |
400-499K | 0 | 315 | 774 | |
500K+ | 35 | 266 | 678 | |
Total Working Age Population | 11,569 | 68,779 | 194,748 | |
In Work Force | 8,310 | 42,774 | 121,021 | |
Not In Work Force | 3,258 | 26,005 | 73,728 | |
Workforce Employed | 7,658 | 39,409 | 112,854 | |
Workforce Unemployed | 634 | 3,345 | 8,052 | |
Civlian Workforce | 8,291 | 42,754 | 120,906 | |
Military Workforce | 19 | 19 | 114 | |
Total Households | 7,317 | 33,510 | 86,948 | |
Family Households | 3,377 | 21,317 | 59,913 | |
Non-Family Households | 3,940 | 12,193 | 27,035 | |
Married Couple | 953 | 10,497 | 33,658 | |
Other Family | 2,424 | 10,820 | 26,254 | |
Married w/Child | 485 | 3,784 | 12,974 | |
Single Male w/Child | 319 | 1,045 | 2,614 | |
Single Female w/Child | 1,476 | 4,953 | 10,956 |
Population Change Last Two Decades - Plus Projection
2000 | % | 2010 | % | 2020 | % | 2030 | |
---|---|---|---|---|---|---|---|
Texas | 20,851,820 | +21 | 25,145,561 | +18 | 29,677,668 | +18 | 34,894,452 |
Dallas County | 2,218,899 | +7 | 2,368,139 | +15 | 2,734,111 | +14 | 3,106,298 |
Total Working Age Population:
Total Households:
Total Working Age Population:
Total Households:
Total Working Age Population:
Total Households: