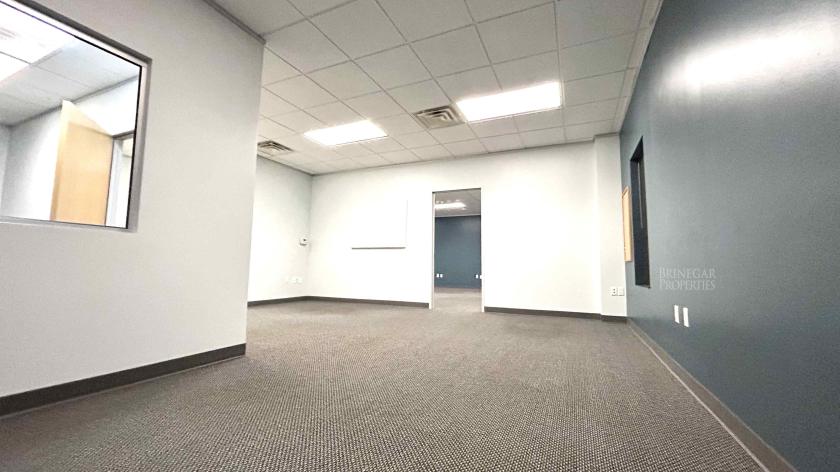
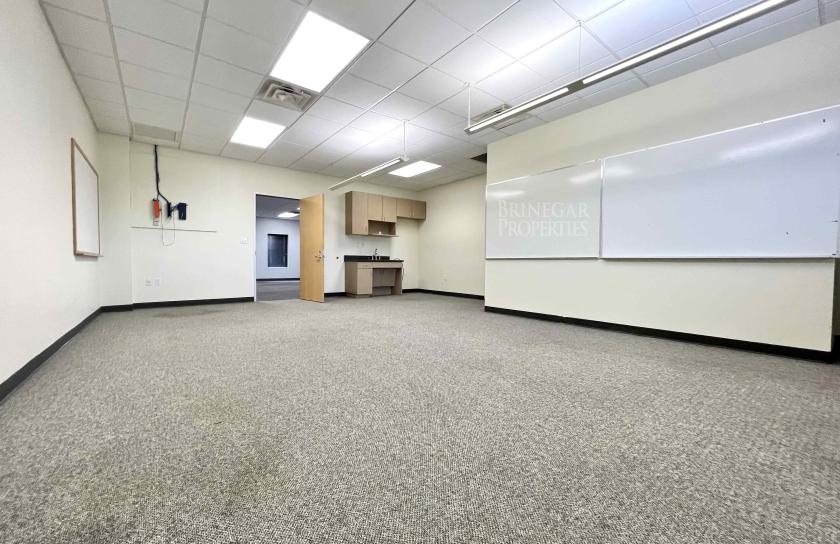
1-Mile | 3-Miles | 5-Miles | ||
---|---|---|---|---|
Total Population | 14,136 | 107,293 | 301,012 | |
Population Median Age | 37 | 35 | 35 | |
Population by Age | 0-9 Yrs | 1472 (10%) | 13331 (12%) | 39073 (12%) |
10-19 Yrs | 795 (5%) | 9092 (8%) | 32100 (10%) | |
20-29 Yrs | 2803 (19%) | 20923 (19%) | 50633 (16%) | |
30-39 Yrs | 3012 (21%) | 24152 (22%) | 62538 (20%) | |
40-49 Yrs | 2154 (15%) | 14193 (13%) | 41347 (13%) | |
50-59 Yrs | 2038 (14%) | 11785 (10%) | 33757 (11%) | |
60-69 Yrs | 1114 (7%) | 8503 (7%) | 24239 (8%) | |
70+ Yrs | 747 (5%) | 5314 (4%) | 17325 (5%) | |
Median HH Income | $71,637 | $70,066 | $69,236 | |
Total Household Income | < 24K | 625 (9%) | 5883 (12%) | 17503 (14%) |
25-49K | 1359 (19%) | 9478 (19%) | 24692 (19%) | |
50-74K | 1665 (24%) | 10647 (22%) | 25653 (20%) | |
75-99K | 1244 (18%) | 7109 (14%) | 17245 (13%) | |
100-199K | 1684 (24%) | 12310 (25%) | 31682 (25%) | |
200K+ | 250 (3%) | 2566 (5%) | 8180 (6%) | |
Highest Education Level | No Diploma | 652 | 5779 | 22507 |
Diploma or GED | 1340 | 12934 | 38172 | |
Some College | 2348 | 15048 | 39193 | |
Assoc. Degree | 490 | 4869 | 12633 | |
Bachelors Degree | 4161 | 25760 | 64991 | |
Higher Degree | 2117 | 13996 | 35696 | |
Total Housing Units | 7,365 | 51,796 | 133,694 | |
--Owner-Occupied | 2,541 | 17,273 | 52,683 | |
--Renter-Occupied | 4,286 | 30,719 | 72,271 | |
Owner-Occupied Values | < 100K | 88 | 590 | 2713 |
100-199K | 582 | 2893 | 9619 | |
200-299K | 841 | 5798 | 17013 | |
300-399K | 582 | 5043 | 11563 | |
400-499K | 327 | 1909 | 6022 | |
500K+ | 121 | 1040 | 5753 | |
Total Working Age Population | 12,155 | 88,036 | 242,061 | |
In Work Force | 9,298 | 67,948 | 182,317 | |
Not In Work Force | 2,857 | 20,089 | 59,744 | |
Workforce Employed | 8,931 | 65,098 | 173,922 | |
Workforce Unemployed | 359 | 2,804 | 8,309 | |
Civlian Workforce | 9,290 | 67,901 | 182,231 | |
Military Workforce | 7 | 46 | 86 | |
Total Households | 6,828 | 47,992 | 124,955 | |
Family Households | 2,941 | 23,870 | 67,785 | |
Non-Family Households | 3,887 | 24,122 | 57,169 | |
Married Couple | 2,318 | 17,625 | 49,287 | |
Other Family | 623 | 6,245 | 18,498 | |
Married w/Child | 966 | 7,976 | 23,028 | |
Single Male w/Child | 95 | 1,068 | 2,736 | |
Single Female w/Child | 166 | 2,066 | 6,807 |
Population Change Last Two Decades - Plus Projection
2000 | % | 2010 | % | 2020 | % | 2030 | |
---|---|---|---|---|---|---|---|
Texas | 20,851,820 | +21 | 25,145,561 | +18 | 29,677,668 | +18 | 34,894,452 |
Travis County | 812,280 | +26 | 1,024,266 | +26 | 1,291,502 | +19 | 1,540,812 |
Williamson County | 249,967 | +69 | 422,679 | +40 | 589,914 | +41 | 830,421 |
Total Working Age Population:
Total Households:
Total Working Age Population:
Total Households:
Total Working Age Population:
Total Households: