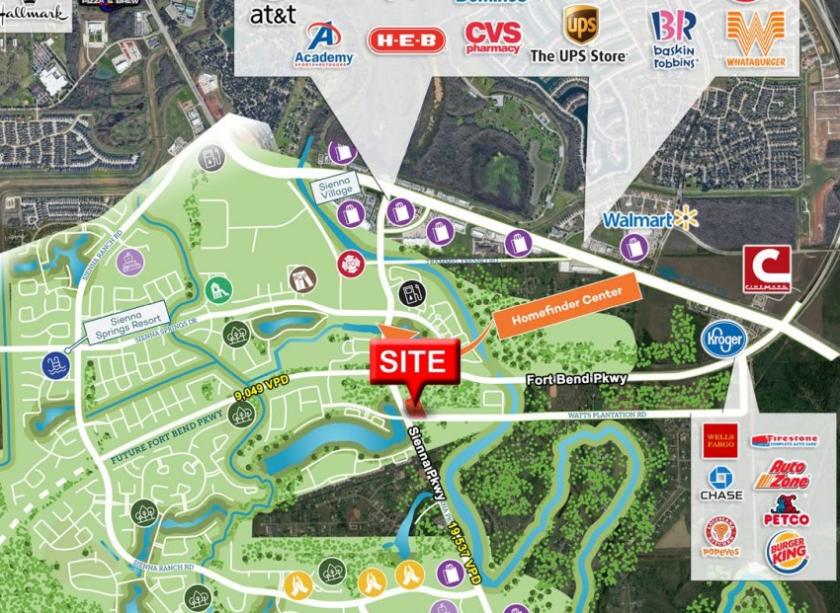
1-Mile | 3-Miles | 5-Miles | ||
---|---|---|---|---|
Total Population | 4,782 | 59,397 | 135,071 | |
Population Median Age | 36 | 36 | 36 | |
Population by Age | 0-9 Yrs | 694 (14%) | 9024 (15%) | 19678 (14%) |
10-19 Yrs | 811 (16%) | 9662 (16%) | 20713 (15%) | |
20-29 Yrs | 498 (10%) | 5780 (9%) | 14664 (10%) | |
30-39 Yrs | 633 (13%) | 8264 (13%) | 18685 (13%) | |
40-49 Yrs | 765 (15%) | 9416 (15%) | 20883 (15%) | |
50-59 Yrs | 660 (13%) | 8089 (13%) | 17804 (13%) | |
60-69 Yrs | 415 (8%) | 5520 (9%) | 13985 (10%) | |
70+ Yrs | 307 (6%) | 3643 (6%) | 8658 (6%) | |
Median HH Income | $110,768 | $123,055 | $102,737 | |
Total Household Income | < 24K | 60 (3%) | 813 (4%) | 3102 (7%) |
25-49K | 113 (6%) | 1187 (6%) | 4543 (10%) | |
50-74K | 417 (25%) | 2366 (13%) | 7170 (17%) | |
75-99K | 164 (10%) | 2160 (11%) | 5631 (13%) | |
100-199K | 557 (34%) | 7860 (43%) | 14856 (35%) | |
200K+ | 319 (19%) | 3770 (20%) | 6840 (16%) | |
Highest Education Level | No Diploma | 93 | 1759 | 7107 |
Diploma or GED | 290 | 4399 | 14152 | |
Some College | 481 | 6220 | 15311 | |
Assoc. Degree | 293 | 3574 | 7234 | |
Bachelors Degree | 1044 | 12185 | 24204 | |
Higher Degree | 880 | 9264 | 18381 | |
Total Housing Units | 1,769 | 18,750 | 43,935 | |
--Owner-Occupied | 1,012 | 15,651 | 35,370 | |
--Renter-Occupied | 617 | 2,506 | 6,773 | |
Owner-Occupied Values | < 100K | 18 | 339 | 2139 |
100-199K | 35 | 1915 | 9108 | |
200-299K | 242 | 4736 | 9672 | |
300-399K | 316 | 4648 | 7056 | |
400-499K | 140 | 1953 | 3330 | |
500K+ | 261 | 2060 | 4064 | |
Total Working Age Population | 3,655 | 44,263 | 102,552 | |
In Work Force | 2,411 | 31,243 | 71,067 | |
Not In Work Force | 1,244 | 13,020 | 31,485 | |
Workforce Employed | 2,317 | 29,577 | 66,593 | |
Workforce Unemployed | 82 | 1,653 | 4,454 | |
Civlian Workforce | 2,399 | 31,230 | 71,048 | |
Military Workforce | 12 | 13 | 20 | |
Total Households | 1,629 | 18,157 | 42,142 | |
Family Households | 1,304 | 15,636 | 35,155 | |
Non-Family Households | 325 | 2,521 | 6,987 | |
Married Couple | 928 | 13,219 | 27,325 | |
Other Family | 377 | 2,417 | 7,830 | |
Married w/Child | 571 | 7,558 | 14,450 | |
Single Male w/Child | 68 | 211 | 519 | |
Single Female w/Child | 152 | 989 | 2,565 |
Population Change Last Two Decades - Plus Projection
2000 | % | 2010 | % | 2020 | % | 2030 | |
---|---|---|---|---|---|---|---|
Texas | 20,851,820 | +21 | 25,145,561 | +18 | 29,677,668 | +18 | 34,894,452 |
Fort Bend County | 354,452 | +65 | 585,375 | +44 | 840,383 | +43 | 1,203,029 |
Total Working Age Population:
Total Households:
Total Working Age Population:
Total Households:
Total Working Age Population:
Total Households: