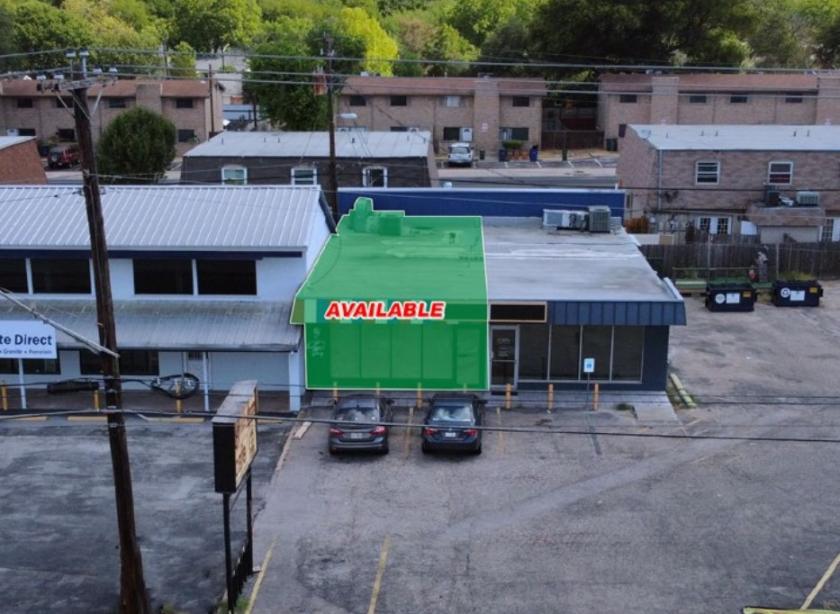
1-Mile | 3-Miles | 5-Miles | ||
---|---|---|---|---|
Total Population | 19,960 | 159,955 | 350,186 | |
Population Median Age | 36 | 35 | 35 | |
Population by Age | 0-9 Yrs | 2405 (12%) | 19666 (12%) | 38822 (11%) |
10-19 Yrs | 2480 (12%) | 17087 (10%) | 40901 (11%) | |
20-29 Yrs | 2877 (14%) | 30557 (19%) | 74122 (21%) | |
30-39 Yrs | 4431 (22%) | 33562 (20%) | 67887 (19%) | |
40-49 Yrs | 3103 (15%) | 20146 (12%) | 43527 (12%) | |
50-59 Yrs | 1741 (8%) | 16481 (10%) | 34733 (9%) | |
60-69 Yrs | 1691 (8%) | 12256 (7%) | 27773 (7%) | |
70+ Yrs | 1231 (6%) | 10199 (6%) | 22419 (6%) | |
Median HH Income | $67,443 | $59,254 | $67,259 | |
Total Household Income | < 24K | 1538 (18%) | 12990 (19%) | 25824 (17%) |
25-49K | 1513 (18%) | 15773 (23%) | 28922 (20%) | |
50-74K | 1488 (17%) | 11264 (16%) | 24231 (16%) | |
75-99K | 945 (11%) | 8118 (12%) | 17267 (11%) | |
100-199K | 2039 (24%) | 14059 (20%) | 33325 (23%) | |
200K+ | 772 (9%) | 5403 (7%) | 15034 (10%) | |
Highest Education Level | No Diploma | 1607 | 16239 | 24602 |
Diploma or GED | 2401 | 19444 | 34469 | |
Some College | 2521 | 16987 | 36498 | |
Assoc. Degree | 809 | 5571 | 11518 | |
Bachelors Degree | 4237 | 33286 | 78339 | |
Higher Degree | 2744 | 21420 | 52309 | |
Total Housing Units | 8,881 | 73,169 | 157,281 | |
--Owner-Occupied | 3,671 | 24,562 | 57,959 | |
--Renter-Occupied | 4,624 | 43,046 | 86,645 | |
Owner-Occupied Values | < 100K | 130 | 946 | 1754 |
100-199K | 471 | 3458 | 6500 | |
200-299K | 495 | 4432 | 10330 | |
300-399K | 742 | 4005 | 10642 | |
400-499K | 946 | 3962 | 9001 | |
500K+ | 886 | 7759 | 19732 | |
Total Working Age Population | 15,817 | 129,349 | 291,418 | |
In Work Force | 11,929 | 96,035 | 209,179 | |
Not In Work Force | 3,889 | 33,314 | 82,240 | |
Workforce Employed | 11,253 | 91,501 | 198,971 | |
Workforce Unemployed | 675 | 4,500 | 10,099 | |
Civlian Workforce | 11,929 | 96,002 | 209,070 | |
Military Workforce | 0 | 34 | 108 | |
Total Households | 8,294 | 67,608 | 144,604 | |
Family Households | 3,730 | 32,482 | 69,438 | |
Non-Family Households | 4,564 | 35,125 | 75,166 | |
Married Couple | 2,534 | 22,949 | 51,230 | |
Other Family | 1,196 | 9,533 | 18,207 | |
Married w/Child | 1,391 | 10,723 | 22,203 | |
Single Male w/Child | 113 | 1,308 | 2,298 | |
Single Female w/Child | 587 | 3,649 | 6,965 |
Population Change Last Two Decades - Plus Projection
2000 | % | 2010 | % | 2020 | % | 2030 | |
---|---|---|---|---|---|---|---|
Texas | 20,851,820 | +21 | 25,145,561 | +18 | 29,677,668 | +18 | 34,894,452 |
Travis County | 812,280 | +26 | 1,024,266 | +26 | 1,291,502 | +19 | 1,540,812 |
Total Working Age Population:
Total Households:
Total Working Age Population:
Total Households:
Total Working Age Population:
Total Households: