Flex-Office-Warehouse
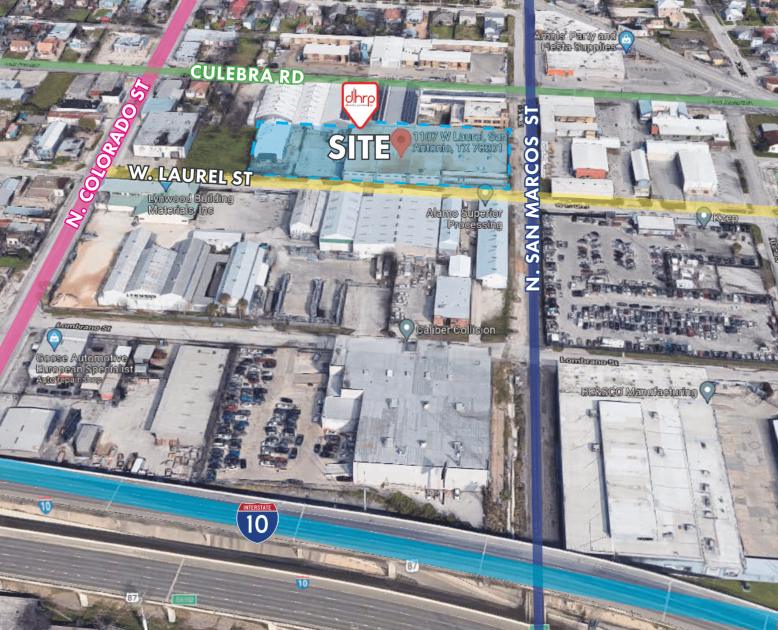
1107 West Laurel Street San Antonio, TX 78201
1107 West Laurel Street San Antonio, TX 78201

Details & Description
Property Highlights
• Three blocks east of the IH-10/ Culebra exit and two blocks west of “Five Points”
• Two buildings totaling ± 54,092 SF
Additional Photos


Listing Agents

Charles Jeffers
O: 210-222-2424
M: 210-213-4722
cjeffers@dhrp.us
O: 210-222-2424
M: 210-213-4722
cjeffers@dhrp.us
While we strive to provide the most accurate information, all listing information, and demographic data, is provided by third-parties. As such, MyEListing will not be responsible for the accuracy of the information. It is strongly recommended that you verify all information with the listing agent, and any relevant agencies, prior to making any decisions.


