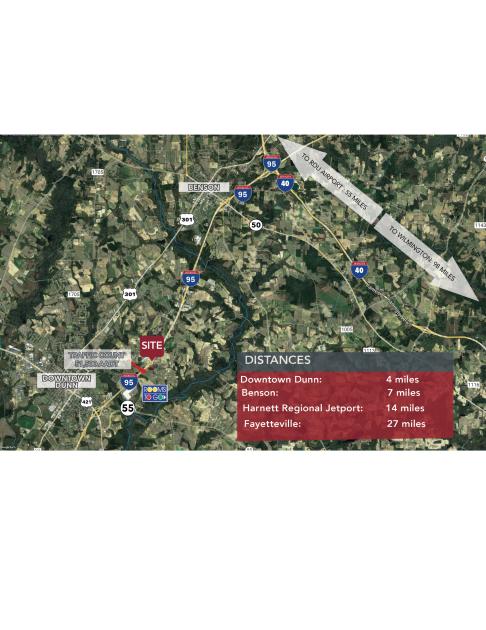
1-Mile | 3-Miles | 5-Miles | ||
---|---|---|---|---|
Total Population | 569 | 8,597 | 19,971 | |
Population Median Age | 42 | 42 | 42 | |
Population by Age | 0-9 Yrs | 40 (7%) | 830 (9%) | 2151 (10%) |
10-19 Yrs | 114 (20%) | 1107 (12%) | 2378 (11%) | |
20-29 Yrs | 35 (6%) | 1054 (12%) | 2493 (12%) | |
30-39 Yrs | 73 (12%) | 1019 (11%) | 2104 (10%) | |
40-49 Yrs | 72 (12%) | 1039 (12%) | 2439 (12%) | |
50-59 Yrs | 80 (14%) | 1183 (13%) | 2583 (12%) | |
60-69 Yrs | 81 (14%) | 1112 (12%) | 2628 (13%) | |
70+ Yrs | 73 (12%) | 1254 (14%) | 3194 (15%) | |
Median HH Income | $41,814 | $35,589 | $38,719 | |
Total Household Income | < 24K | 76 (33%) | 1263 (35%) | 2694 (33%) |
25-49K | 52 (23%) | 976 (27%) | 2181 (27%) | |
50-74K | 34 (15%) | 568 (16%) | 1362 (17%) | |
75-99K | 17 (7%) | 251 (7%) | 703 (8%) | |
100-199K | 42 (18%) | 378 (10%) | 838 (10%) | |
200K+ | 5 (2%) | 95 (2%) | 207 (2%) | |
Highest Education Level | No Diploma | 61 | 956 | 2410 |
Diploma or GED | 132 | 2185 | 4979 | |
Some College | 94 | 1341 | 3068 | |
Assoc. Degree | 21 | 566 | 1444 | |
Bachelors Degree | 65 | 762 | 1556 | |
Higher Degree | 21 | 306 | 685 | |
Total Housing Units | 286 | 4,210 | 9,461 | |
--Owner-Occupied | 150 | 2,054 | 4,839 | |
--Renter-Occupied | 75 | 1,478 | 3,145 | |
Owner-Occupied Values | < 100K | 49 | 814 | 1926 |
100-199K | 65 | 858 | 2013 | |
200-299K | 14 | 222 | 573 | |
300-399K | 16 | 82 | 167 | |
400-499K | 1 | 39 | 91 | |
500K+ | 5 | 40 | 69 | |
Total Working Age Population | 434 | 6,956 | 16,229 | |
In Work Force | 240 | 3,748 | 8,768 | |
Not In Work Force | 194 | 3,208 | 7,461 | |
Workforce Employed | 231 | 3,472 | 8,307 | |
Workforce Unemployed | 10 | 270 | 441 | |
Civlian Workforce | 240 | 3,742 | 8,748 | |
Military Workforce | 0 | 5 | 20 | |
Total Households | 225 | 3,532 | 7,984 | |
Family Households | 142 | 2,077 | 4,889 | |
Non-Family Households | 83 | 1,455 | 3,095 | |
Married Couple | 114 | 1,347 | 3,391 | |
Other Family | 29 | 730 | 1,498 | |
Married w/Child | 39 | 424 | 1,036 | |
Single Male w/Child | 2 | 65 | 131 | |
Single Female w/Child | 16 | 308 | 668 |
Population Change Last Two Decades - Plus Projection
2000 | % | 2010 | % | 2020 | % | 2030 | |
---|---|---|---|---|---|---|---|
North Carolina | 8,049,313 | +18 | 9,535,483 | +11 | 10,630,691 | +11 | 11,836,070 |
Harnett County | 91,025 | +26 | 114,678 | +20 | 137,358 | +15 | 158,563 |
Sampson County | 60,161 | +5 | 63,431 | +2 | 64,458 | +1 | 65,308 |
Johnston County | 121,965 | +38 | 168,878 | +26 | 212,401 | +27 | 269,736 |
Total Working Age Population:
Total Households:
Total Working Age Population:
Total Households:
Total Working Age Population:
Total Households: