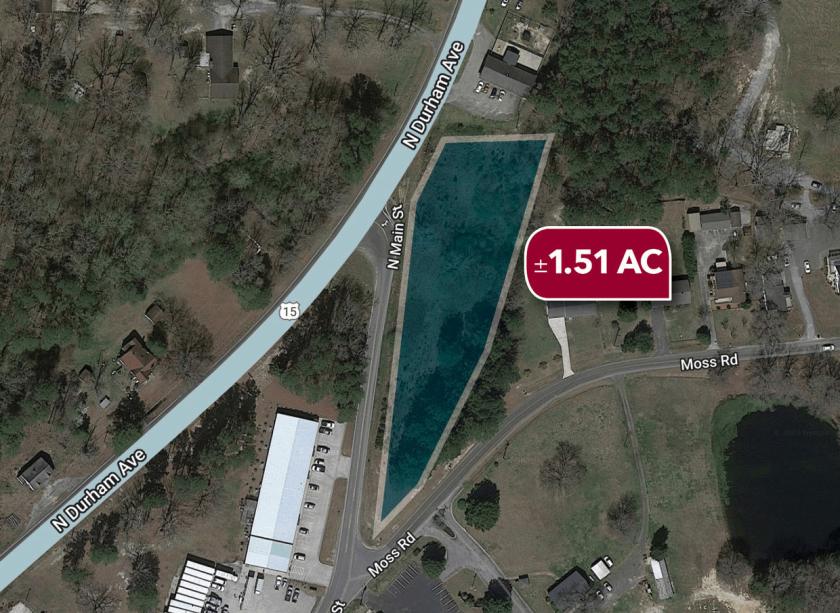
1-Mile | 3-Miles | 5-Miles | ||
---|---|---|---|---|
Total Population | 631 | 5,448 | 14,206 | |
Population Median Age | 39 | 39 | 39 | |
Population by Age | 0-9 Yrs | 119 (18%) | 769 (14%) | 1773 (12%) |
10-19 Yrs | 29 (4%) | 560 (10%) | 1683 (11%) | |
20-29 Yrs | 63 (9%) | 542 (9%) | 1623 (11%) | |
30-39 Yrs | 78 (12%) | 511 (9%) | 1412 (9%) | |
40-49 Yrs | 84 (13%) | 1113 (20%) | 2484 (17%) | |
50-59 Yrs | 151 (23%) | 1138 (20%) | 2657 (18%) | |
60-69 Yrs | 92 (14%) | 555 (10%) | 1430 (10%) | |
70+ Yrs | 17 (2%) | 259 (4%) | 1143 (8%) | |
Median HH Income | $79,912 | $70,829 | $63,512 | |
Total Household Income | < 24K | 35 (14%) | 285 (13%) | 786 (14%) |
25-49K | 32 (13%) | 311 (14%) | 1185 (22%) | |
50-74K | 36 (15%) | 560 (26%) | 1184 (22%) | |
75-99K | 89 (37%) | 438 (20%) | 862 (16%) | |
100-199K | 48 (20%) | 508 (23%) | 1175 (22%) | |
200K+ | 0 (0%) | 19 (0%) | 86 (1%) | |
Highest Education Level | No Diploma | 53 | 355 | 1643 |
Diploma or GED | 135 | 1082 | 2746 | |
Some College | 90 | 770 | 1975 | |
Assoc. Degree | 43 | 439 | 1074 | |
Bachelors Degree | 92 | 696 | 1527 | |
Higher Degree | 44 | 496 | 1000 | |
Total Housing Units | 277 | 2,622 | 6,099 | |
--Owner-Occupied | 189 | 1,664 | 4,090 | |
--Renter-Occupied | 51 | 456 | 1,187 | |
Owner-Occupied Values | < 100K | 8 | 208 | 879 |
100-199K | 36 | 639 | 1683 | |
200-299K | 138 | 721 | 1173 | |
300-399K | 4 | 66 | 207 | |
400-499K | 3 | 22 | 97 | |
500K+ | 0 | 9 | 52 | |
Total Working Age Population | 499 | 4,382 | 11,398 | |
In Work Force | 343 | 3,133 | 7,564 | |
Not In Work Force | 156 | 1,248 | 3,835 | |
Workforce Employed | 336 | 3,021 | 7,218 | |
Workforce Unemployed | 6 | 104 | 326 | |
Civlian Workforce | 343 | 3,125 | 7,544 | |
Military Workforce | 0 | 8 | 20 | |
Total Households | 240 | 2,120 | 5,277 | |
Family Households | 210 | 1,731 | 4,099 | |
Non-Family Households | 31 | 390 | 1,178 | |
Married Couple | 199 | 1,385 | 3,060 | |
Other Family | 11 | 346 | 1,039 | |
Married w/Child | 65 | 554 | 1,121 | |
Single Male w/Child | 1 | 45 | 227 | |
Single Female w/Child | 4 | 128 | 338 |
Population Change Last Two Decades - Plus Projection
2000 | % | 2010 | % | 2020 | % | 2030 | |
---|---|---|---|---|---|---|---|
North Carolina | 8,049,313 | +18 | 9,535,483 | +11 | 10,630,691 | +11 | 11,836,070 |
Wake County | 627,846 | +44 | 900,993 | +23 | 1,109,883 | +20 | 1,328,336 |
Granville County | 48,498 | +24 | 59,916 | +4 | 62,147 | +12 | 69,540 |
Total Working Age Population:
Total Households:
Total Working Age Population:
Total Households:
Total Working Age Population:
Total Households: